Share – Nhờ phương pháp ‘cha mẹ hổ’, những đứa trẻ từng khóc vì khổ cực ngày xưa đã trở thành thiên tài — Ngon 24h

Gar Jun Ho Khi lên 3 tuổi, Ho đã có thể đọc, viết thành thạo. 4 tuổi, em thuộc lòng bảng tính nhân chia. 8 tuổi, em đỗ kỳ thi âm nhạc cấp độ 5 tại Anh (cấp độ 8 là cao nhất). Ho đứng thứ nhất vòng tứ kết cuộc thi khoa học do […]

via Nhờ phương pháp ‘cha mẹ hổ’, những đứa trẻ từng khóc vì khổ cực ngày xưa đã trở thành thiên tài — Ngon 24h

Gar Jun Ho

Khi lên 3 tuổi, Ho đã có thể đọc, viết thành thạo. 4 tuổi, em thuộc lòng bảng tính nhân chia. 8 tuổi, em đỗ kỳ thi âm nhạc cấp độ 5 tại Anh (cấp độ 8 là cao nhất).

Ho đứng thứ nhất vòng tứ kết cuộc thi khoa học do chương trình Child Genius tổ chức tại Anh. Trước khi diễn ra cuộc thi, bố mẹ Ho bắt em ôn tập hàng ngày. Em chỉ có 3 phút nghỉ ngơi giữa các bài học.

 Nhờ phương pháp cha mẹ hổ, những đứa trẻ từng khóc vì khổ cực ngày xưa đã trở thành thiên tài - Ảnh 1.

Thế nhưng, bấy nhiêu vẫn không đủ để làm bà Faye – mẹ của Ho – vừa lòng. Bà nói với em sau cuộc thi: “Con quá nóng vội vì thế con đã mắc sai lầm và không thể đạt điểm tuyệt đối”.

Phản ứng của bà Faye đã gây một làn sóng phẫn nộ trong cộng đồng mạng và thổi bùng lên cuộc tranh luận chưa có hồi kết về cách những ông bố, bà mẹ “hổ” châu Á nuôi dạy con.

Nhiều người chỉ trích: “Mẹ của Ho thật quá đáng! Hãy để cho bọn trẻ được vui vẻ, thời thơ ấu của chúng ngắn ngủi lắm. Thật đáng sợ khi thấy cháu bị thúc ép như vậy”.

Lang Lang

Lang Lang rất có thể sẽ là hình mẫu của Gar Jun Ho khi trưởng thành. Thiên tài piano này nhớ lại, bố của anh – ông Lang Guoren – đã nghiêm khắc như thế nào khi anh còn nhỏ.

Khi Lang lên 5, bố anh bỏ công việc đang làm để đưa con trai lên Bắc Kinh học chơi piano, những mong con viết tiếp giấc mơ âm nhạc dang dở của bố mẹ.

Nhưng giáo viên hướng dẫn sau đó đuổi Lang ra khỏi lớp, cho rằng cậu bé không có năng khiếu âm nhạc.

Trong cuốn tự truyện Journey of a Thousand Miles (tạm dịch: Hành trình nghìn dặm) của mình, Lang kể lại, bố anh đã rất điên tiết khi biết chuyện và thậm chí còn đe dọa anh bằng cái chết.

Sau chuyện đó, giữa Lang Lang và bố diễn ra “chiến tranh lạnh”. Tình cảm giữa hai bố con cũng như đam mê chơi đàn của Lang Lang chỉ được nối lại nhờ lời khuyên của một người hàng xóm.

 Nhờ phương pháp cha mẹ hổ, những đứa trẻ từng khóc vì khổ cực ngày xưa đã trở thành thiên tài - Ảnh 2.

Lang Lang sau đó chăm chỉ luyện tập, từ 8 đến 9 tiếng mỗi ngày và liên tục chinh phục những đỉnh cao trong nước cũng như quốc tế.

Lang Lang được tạp chí Times bình chọn là một trong 100 người có sức ảnh hưởng lớn nhất thế giới.

“Tôi chưa một lần cầu xin bố mẹ giảm bớt áp lực lên mình. Tôi chấp nhận chuyện đó, thậm chí còn thấy thoải mái với nó”, anh viết trong cuốn tự truyện của mình.

Huang Doudou

Giống như Lang Lang, Huang Doudou – một trong những vũ công cổ điển nổi tiếng nhất tại Trung Quốc, cũng có một người cha nghiêm khắc.

Hai lần thi vào Học viện Khiêu vũ Bắc Kinh theo nguyện vọng của bố mẹ, anh đều trượt bởi ban giám khảo cho rằng chân của anh quá ngắn.

 Nhờ phương pháp cha mẹ hổ, những đứa trẻ từng khóc vì khổ cực ngày xưa đã trở thành thiên tài - Ảnh 3.

Cha anh sau đó đã buộc chân cậu con trai vào vòng sắt và treo ngược lên xà nhà mỗi ngày để tăng chiều cao của con. Sau 3 tháng, Huang cao thêm 3 cm và được nhận vào học tại Trường Khiêu vũ Thượng Hải.

Mặc dù vậy, Huang cho rằng, đây là một phương pháp nguy hiểm, chưa được khoa học kiểm chứng và hy vọng không có bậc phụ huynh nào “noi gương” cha anh, thử nghiệm trên chính con cái của mình.

“Là con một trong nhà, tôi nhận được tình thương yêu của bố mẹ, nhưng cũng đồng thời phải chịu sức ép từ kỳ vọng của họ”, Huang chia sẻ.

Mặc dù sự thành công của Huang đã vượt xa kỳ vọng của cha mẹ, nhưng cũng phải mất nhiều năm, anh mới tự vun đắp được cho mình tình yêu với nghệ thuật khiêu vũ.

Dong Qing

Là một người dẫn chương trình nổi tiếng, thường xuyên đảm nhiệm những chương trình lớn của Trung Quốc, ít ai biết được Dong Qing đã trải qua một tuổi thơ khắc nghiệt như thế nào.

 Nhờ phương pháp cha mẹ hổ, những đứa trẻ từng khóc vì khổ cực ngày xưa đã trở thành thiên tài - Ảnh 4.

Bố mẹ của Dong cấm cô soi gương và chưng diện quần áo mới ngay khi con gái còn nhỏ, để cô có thể toàn tâm toàn ý cho việc học tập.

Trong một cuộc phỏng vấn trên truyền hình, Dong cho biết, cô bị bắt phải trích dẫn thơ văn tiếng Trung và chạy 1.000m mỗi sáng.

Cô đã từng cảm thấy rất ghét bố mẹ mình, nhưng sau này nhận ra, chính nhờ sự nghiêm khắc của họ mà cô mới có được thành công ngày hôm nay.

Theo Thanh Hương – Helino

Share – Nổi tiếng là gian hùng một thời, nhưng bạn có biết cuộc sống của Tào Tháo mộc mạc thế nào không? — Ngon 24h

Trong số ba chính quyền Tào Lưu Tôn thời Tam Quốc, người lợi hại nhất là Tào Tháo, bất kể là trong lịch sử phát triển hay quản lý sau này, Lưu Bị và Tôn Quyền đều không thể sánh được với Tào Tháo. Tào Tháo không chỉ là một nhà lãnh đạo mà còn […]

via Nổi tiếng là gian hùng một thời, nhưng bạn có biết cuộc sống của Tào Tháo mộc mạc thế nào không? — Ngon 24h

Trong số ba chính quyền Tào Lưu Tôn thời Tam Quốc, người lợi hại nhất là Tào Tháo, bất kể là trong lịch sử phát triển hay quản lý sau này, Lưu Bị và Tôn Quyền đều không thể sánh được với Tào Tháo. Tào Tháo không chỉ là một nhà lãnh đạo mà còn là một chính trị gia, dù trong tiểu thuyết sau này Tào Tháo bị “bôi đen” khá thảm, nhưng những gì Tào Tháo đã đóng góp cho bách tính Tam Quốc đều luôn nhiều hơn hai vị lãnh đạo còn lại.

Sau trận Quan Độ, Tào Tháo trở thành chư hầu mạnh nhất lúc bấy giờ, hoàn toàn tương đương với hoàng đế, nhưng cuộc sống của ông lại rất đạm bạc, mặc dù có tham vọng thống nhất thiên hạ, nhưng sau trận Quan Độ, Tào Tháo vẫn ra lệnh khôi phục và phát triển trong ba năm, vì chiến tranh liên miên, nhiều binh sĩ thiệt mạng, cần khôi phục lại nguyên khí của đất nước.

Vào mùa xuân năm Kiến An thứ bảy, Tào Tháo về quê mình là huyện Tiêu (nay là Bặc Châu, tỉnh An Huy). Đây là lần đầu tiên ông quay trở về quê kể từ sau cuộc thảo phạt Đổng Trác. Sau 13 năm, thấy những người ở quê nhà phải chịu khổ cực do chiến tranh, nhiều gia đình có con đi lính bị chết, người bạn thưở nào cũng đã mất, Tào Tháo vô cùng đau lòng, “huyện trung chung nhật hành, cánh bất kiến sở thức cố cựu nhất nhân, sử Ngộ thê thương thương hoài”.

Nổi tiếng là gian hùng một thời, nhưng bạn có biết cuộc sống của Tào Tháo mộc mạc thế nào không? - Ảnh 1.

Tượng Tào Tháo trước nhà ga Bặc Châu, An Huy

Trông thấy cảnh tượng này, Tào Tháo đã ra lệnh cứu trợ cho các gia đình của các chiến binh đã chết trong chiến tranh, phân cho họ ruộng đất, lập trường học cho con cái của họ, mời thầy về dạy đọc sách, phục hưng lại các công trình thủy lợi, thực thi chế độ đồn điền, di tích của những chế độ này của Tào Tháo vẫn còn tồn tại cho tới ngày nay, chẳng hạn như Quan Giá đài ở Bặc Châu, An Huy.

Quan Giá đài là đài quan sát mà Tào Tháo đặc biệt cho xây dựng ở nông trường, ông còn tự mình lên đài để ngắm nhìn sự phát triển của cây trồng để cho người dân thấy được rằng mình luôn quan tâm và giám sát đồn điền, đồng thời hạ lệnh trấn áp cường hào, thiết lập chính sách quản lý muối, sắt, giúp đỡ dân yếu, thắt chặt pháp lệnh, đồng thời nghiêm cấm tiến hành an tang quá long trọng.

Cuộc sống của Tào Tháo cũng không hề hoa lệ, màn trướng bình phong hỏng thì sửa lại, chiếc giường cũng được ông sử dụng trong mười năm. Tào Tháo không bao giờ sử dụng kim lũ ngọc y (áo ngọc được kết bằng dây vàng), uống rượu bằng chén ngọc, những người bên cạnh của Tào Tháo cũng vậy, có một lần thê tử của Tào Thực mặc trang phục lộng lẫy, Tào Tháo sau khi nhìn thấy đã lấy tội danh vi phạm gia quy mà ban cho nàng cái chết.

Nổi tiếng là gian hùng một thời, nhưng bạn có biết cuộc sống của Tào Tháo mộc mạc thế nào không? - Ảnh 2.

Nhân vật Tào Tháo trên màn ảnh

Biện thị, phu nhân của Tào Tháo từng nói: “Ngộ sự Hán Vũ tứ ngũ tập niên, hành kiệm nhật cữu, bất năng tự biến vi xa” (ý muốn nói đã mấy chục năm sống tiết kiệm rồi, không thể nào tự trở nên xa xỉ được). Thông thường, Tào gia nếu có hỉ sự gì, mời họ hàng thân thích cũng chỉ là “thái thực túc phạn, vô ngư nhục” (cơm rau, không có thịt cá). Sự tiết kiệm của Tào Tháo đã trở thành gia phong của nhà họ Tào, Tào Phi sau khi kế thừa cũng giản dị như vậy, bản thân khi bị bệnh còn bày tỏ không muốn tổ chức an táng long trọng, xa xỉ.

Dưới sự thúc đẩy của Tào Tháo, Tào Phi, rất nhiều trọng thần của Tào Ngụy cũng đều rất tiết kiệm và thanh liêm, chẳng hạn như Hạ Hầu Đôn “tuy tại quân lữ, thân nghênh sư thụ nghiệp, tính thanh kiệm, hữu dư tài triếp dĩ phân thi, bất túc tư chi vu quan, bất trị sản nghiệp” (Hạ Hầu Đôn trong quân ngũ luôn tự mình hướng dẫn, dạy dỗ binh dưới, tính tình tiết kiệm, giản dị, có tiền đều chia cho mọi người, lúc làm quan cũng vậy, những đồng lương mà ông nhận đều luôn ít hơn số tiền mà ông đáng được nhận, lúc sống không tham tài, lúc mất được phong “trung hầu”), Tuân Úc “gia vô dư tài” (không dư tài sản), Hoa Hâm “tố thanh bần, lộc tứ dĩ chấn thi thân thích cố nhân” (xưa nay đều nghèo nàn, bổng lộc đều đem đi giúp đỡ bạn bè, người thân), Trương Phạm “cứu tuất cùng phạt, gia vô dư tư” (cứu giúp người nghèo, nhà không dư tài sản…

Có thể nhiều người biết đến Tào Tháo với tư cách là một gian hùng, một người mưu mô, xảo quyệt, nhưng thực ra, Tào Tháo cũng có một cuộc sống rất mộc mạc và giản dị.

Như Nguyễn – Theo Trí Thức Trẻ

Share – Người Việt đọc 1 quyển sách/năm, nhưng 4 tiếng/ngày cho Facebook — thân tri

Thanh Thủy Người Việt thuộc nhóm ít đọc sách nhất thế giới, nhưng lại lọt top thế giới về sử dụng mạng xã hội, đặc biệt là Facebook. Tại tọa đàm “Làm gì để tạo thói quen đọc sách cho trẻ?” do Sở Thông tin – Truyền thông TP.HCM phối hợp với […]

via Người Việt đọc 1 quyển sách/năm, nhưng 4 tiếng/ngày cho Facebook — thân tri

Người Việt thuộc nhóm ít đọc sách nhất thế giới, nhưng lại lọt top thế giới về sử dụng mạng xã hội, đặc biệt là Facebook.

2

Tại tọa đàm “Làm gì để tạo thói quen đọc sách cho trẻ?” do Sở Thông tin – Truyền thông TP.HCM phối hợp với Hội Xuất bản Việt Nam và báo Tuổi Trẻ tổ chức ngày 19/4 mới đây đã cung cấp thông tin về việc đọc sách của người Việt Nam.

Cục Xuất bản Việt Nam đã thống kê trong ba năm gần đây, bình quân mỗi năm Việt Nam xuất bản khoảng 400 triệu bản sách. Tuy nhiên, trong số này có hơn 300 triệu bản là sách giáo khoa, giáo trình phục vụ cho nhu cầu học tập, nghiên cứu, tham khảo kiến thức.

Như vậy, trừ sách giáo khoa, sách tham khảo, chỉ còn khoảng chưa tới 100 triệu bản sách/năm cho 95 triệu dân. Điều này đồng nghĩa với việc mỗi năm một người Việt đọc bình quân chừng 1 quyển sách.

Tại Hội thảo khoa học “Xây dựng và phát triển phong trào đọc sách trong cộng đồng” ngày 17/4/2019 ở Hà Nội, ông Nguyễn Quang Thạch, đại diện Chương trình Sách hóa nông thôn cho biết, khi phỏng vấn trên 3.000 học sinh, sinh viên, người lớn trên đường từ Hà Nội vào TP.HCM từ năm 2015, chỉ có khoảng 30 người biết đến 3 cuốn sách được trích dẫn trong SGK là “Những tấm lòng cao cả,” “Robinson Cruiso,” và “Góc sân và khoảng trời.”

Cũng theo ông Thạch, qua các khảo sát trên diện rộng gần 20 năm qua, thì thấy ở nông thôn, ngoại trừ một số gia đình giáo viên, các gia đình khác hầu như không có cuốn sách nào ngoài sách giáo khoa và sách bài tập nâng cao của học sinh.

Còn theo Trung tâm nghiên cứu Việt Nam và Đông Nam Á, có tới 44% người Việt thi thoảng đọc sách và 26% không bao giờ đụng vào sách.

Số lượng bản in, nhất là những đầu sách công cụ có giá trị tư tưởng, hàm lượng tri thức cao, chỉ dừng lại ở mức độ tối thiểu vài ba trăm bản cho đến nghìn bản cho dân số hơn 90 triệu người.

Con số tham khảo về tình trạng đọc sách tại các nước khác như sau: Tại Pháp, Nhật Bản trung bình mỗi người đọc 20 cuốn sách/năm; người dân Singapore đọc 14 cuốn/năm, người Malaysia đọc 12 cuốn/năm; người Trung Quốc đọc 5 cuốn/năm. Đặc biệt tại Ấn Độ, trung bình người dân dành hơn 10 tiếng/tuần cho việc đọc sách.

Bàn về cách xây dựng văn hóa đọc cho người dân, tại các hội thảo, hội nghị, lãnh đạo các bộ, ngành, địa phương đã nhiều lần góp ý các vấn đề liên quan đến kinh phí, vai trò người đứng đầu hay xây dựng mô hình tủ sách học sinh, sách điện tử.

Tuy nhiên, 10 năm nay những giải pháp mang tính “hô hào khẩu hiệu” đó đã có từ lâu nhưng không giải quyết được bài toán để “văn hóa đọc” của người Việt Nam được nâng cao.

Theo ý kiến của nhiều bình luận trên các trang mạng xã hội (MXH), chỉ khi việc dạy và học ở Việt Nam đi vào thực chất, không còn chạy theo thành tích, đối phó; khi người đọc học thật với tinh thần tiếp thu, tích lũy tri thức thật thì mới có việc đọc thật; người tài, có kiến thức cần được trọng dụng thì mới có việc đọc thật, học thật. Chỉ khi đó, văn hoá đọc mới được nâng cao.

Trong khi đó, trái ngược với thời lượng vô cùng ít ỏi dành cho đọc sách, thời gian người Việt dùng cho mạng xã hội lại xếp trong top 10 thế giới.

Theo khảo sát về thói quen sử dụng MXH của người Việt Nam 2018 tiến hành bởi Vinaresearch, trung bình 1 ngày người Việt Nam dành khoảng hơn 2 tiếng để truy cập MXH.

Trong các kênh MXH, phổ biến nhất là Facebook. Thời gian người Việt trên 16 tuổi dành cho Facebook trung bình là gần 4 tiếng/ngày. Sau Facebook, các MXH phổ biến khác là Zalo, Youtube, Instagram.

Khi truy cập MXH, chỉ có 13,4% thời gian được dành cho học tập, còn lại đa số dùng MXH để kết nối, đọc tin tức, giải trí, mua sắm online và các mục đích khác.

(Nguồn : trithucvn.net)

Share – Coi chừng ánh sáng xanh màn hình làm hại mắt — thân tri

Một báo cáo gần đây của các nhà khảo cứu trường Đại Học Toledo đăng trên tập san Scientific Reports cho thấy, sự tiếp xúc kéo dài của mắt với ánh sáng có độ dài sóng ngắn 445 nanometer, thường gọi là “ánh sáng xanh” có thể gây hư hại không […]

via Coi chừng ánh sáng xanh màn hình làm hại mắt — thân tri

Một báo cáo gần đây của các nhà khảo cứu trường Đại Học Toledo đăng trên tập san Scientific Reports cho thấy, sự tiếp xúc kéo dài của mắt với ánh sáng có độ dài sóng ngắn 445 nanometer, thường gọi là “ánh sáng xanh” có thể gây hư hại không thể phục hồi được đối với tế bào thị giác.

Ánh sáng xanh thiên nhiên có trong nắng cùng với những loại ánh sáng khác mắt ta có thể trông thấy được, cùng với tia hồng ngoại. Tuy nhiên theo Giáo Sư Ajith Karunarathne, tác giả bản nghiên cứu, chúng không gây hại cho mắt vì chúng ta không nhìn chằm vào mặt trời lâu. Trong khi với màn hình dụng cụ di động lại khác, trung bình người Mỹ mỗi ngày nhìn vào đó chừng 11 tiếng (theo thăm dò 2016 Nielsen poll).

Để tránh ánh sáng xanh, giới nhà binh vẫn tiếp tục sử dụng ánh sáng đỏ hoặc cam ở màn hình các dụng cụ, kể cả trong phòng điều khiển và phòng lái.

Hãng Apple cho phép người dùng sản phẩm iPhone cài chỉnh màn hình tự động chuyển sang ánh sáng màu hoàng hôn lúc buổi tối.

Ngoài thị trường cũng có bán sản phẩm desktop screen protector, ngăn luồng ánh sáng xanh đi qua con ngươi chúng ta. Giới chơi game máy vi tính cũng có thể mua kính lọc ánh sáng xanh để dùng.

Tuy vậy giới bác sĩ nhãn khoa trấn an chúng ta chớ nên quá lo vì ánh sáng xanh từ mặt trời sẽ át đi mọi tia sáng phát ra từ màn hình. Hiện tại chúng ta được biết ánh sáng xanh của màn hình có vẻ chỉ gây nên chứng mất ngủ. Nhưng tác hại của ánh sáng xanh ngày càng rõ rệt hơn khi độ nhìn của chúng ta đang ngày mỗi mờ thêm. Chúng ta, người tiêu dùng, đòi hỏi phải có sự thay đổi. (tp)

There’s a Lot to Learn About How Blue Light Affects Our Eyes

The “blue screen of death” is taking on a whole new meaning

Popular ScienceEleanor Cummins

2

Blue light’s rap sheet is growing ever longer. Researchers have connected the high-energy visible light, which emanates from both the sun and your cell phone (and just about every other digital device in our hands and on our bedside tables), to disruptions in the body’s circadian rhythms. And physicians have drawn attention to the relationship between our favorite devices and eye problems.

Humans can see a thin spectrum of light, ranging from red to violet. Shorter wavelengths appear blue, while the longer ones appear red. What appears as white light, whether it’s from sunlight or screen time, actually includes almost every color in the spectrum. In a recent paper published in the journal Scientific Reports, researchers at the University of Toledo have begun to parse the process by which close or prolonged exposure to the 445 nanometer shortwave called “blue light” can trigger irreversible damage in cells. But experts say there’s no reason to panic.

“Photoreceptors are like the vehicle. Retinal is the gas,” says study author and chemistry professor Ajith Karunarathne. In the lab, when cells were exposed to blue light directly—in theory, mimicking what happens when we stare at our phone or computer screens—the high-intensity waves trigger a chemical reaction in retinal molecules. The blue light causes the retinal to oxidize, creating “toxic chemical species,” according to Karunarathne. The retinal, energized by this particular band of light, kills cells, which do not grow back once they are damaged. If retinal is the gas, Karunarathne says, then blue light is a dangerous spark.

Catastrophic damage to your vision is hardly guaranteed. Karunarathne says the changes in retinal seen in the study could be linked to macular degeneration, an incurable disease that blurs or even eliminates vision, but manipulating a few cells in the petri dish is very different from actually studying what happens in the human eye.

Blue light occurs naturally in sunlight, which also contains other forms of visible light and ultraviolet and infrared rays. But, Karunarathne points out, we don’t spend that much time staring at the sun. We do, however, spend a lot of time looking at our digital devices. The average American spends almost 11 hours a day in front of some type of screen, according to a 2016 Nielsen poll. Right now, reading this, you’re probably mainlining blue light.

But ophthalmologists aren’t worried. The blue light emanating from the sun drastically overpowers any rays coming from your screen. And so far, all of the research on how real human eyes react to blue light has failed to link screens to permanent damage of any kind. Blue light’s most concerning effects still seems limited to sleeplessness.

Some user experience designers have been criticizing our reliance on blue light, including Amber Case, author of the book Calm Technology. On her Medium blog she documented the way blue light has become “the color of the future,” thanks in part to films like 1982’s Blade Runner. The environmentally-motivated switch from incandescent light bulbs to high-efficiency (and high-wattage) LED bulbs further pushed us into blue light’s path. But, Case writes, “[i]f pop culture has helped lead us into a blue-lit reality that’s hurting us so much, it can help lead us toward a new design aesthetic bathed in orange.”

The military, she notes, still uses red or orange light for many of its interfaces, including those in control rooms and cockpits. “They’re low-impact colors that are great for nighttime shifts,” she writes. They also eliminate blue light-induced “visual artifacts”—the sensation of being blinded by a bright screen in the dark—that often accompany blue light and can be hazardous in some scenarios.

Apple offers a “night shift” setting on its phones, which allow users to blot out the blue and filter their screens through a sunset hue. Aftermarket products designed to control the influx of blue light into our irises are also available, including desktop screen protectors. There are even blue light-filtering sunglasses marketed specifically to gamers. But as the damage done by blue light becomes clearer—just as our vision is getting blurrier—consumers may demand bigger changes.

Going forward, Karunarathne plans to stay in data-collection mode. “This is a new trend of looking at our devices,” he says. “It will take some time to see if and how much damage these devices can cause over time. When this new generation gets older, the question is, by that time, is the damage done?” But now that he appears to have identified a potential biochemical pathway for blue light damage, he’s also looking for new interventions. “Who knows. One day we might be able to develop eye drops, that if you know you are going to be exposed to intense light, you could use some of those … to reduce damage.”

(Sources : getpocket.com)

Share – Câu chuyện không bao giờ cũ: Trầm cảm — TÂM LÝ HỌC, TÂM BỆNH HỌC

Sau đây là các câu trả lời cho các câu hỏi thường gặp về trầm cảm, đặc biệt dành cho các bạn lưu học sinh có quan tâm. Câu hỏi: Chị có thể đưa ra một định nghĩa về trầm cảm và biểu hiện của trầm cảm là như thế nào? Trả lời: Trầm cảm […]

via Câu chuyện không bao giờ cũ: Trầm cảm — TÂM LÝ HỌC, TÂM BỆNH HỌC

Sau đây là các câu trả lời cho các câu hỏi thường gặp về trầm cảm, đặc biệt dành cho các bạn lưu học sinh có quan tâm.

Câu hỏi:

Chị có thể đưa ra một định nghĩa về trầm cảm và biểu hiện của trầm cảm là như thế nào?

Trả lời:

Trầm cảm là một căn bệnh ảnh hưởng tới con người ở mọi khía cạnh: suy nghĩ, cảm xúc và hành xử. Trầm cảm không phải là số phận hay là do nhân cách yếu đuối, bởi nó có thể chạm tới bất kỳ ai trong đời sống, và để lại tác động lớn. Một vài thông tin cho thấy mức độ nghiêm trọng của căn bệnh này:

  • Tổ chức y tế thế giới đánh giá có khoảng 300 triệu người mắc trầm cảm
  • Trầm cảm là tác nhân hàng đầu khiến con người suy giảm hiệu năng và góp phần đáng kể vào gánh nặng bệnh tật trên thế giới.
  • Trong trường hợp tệ nhất, trầm cảm dẫn tới cái chết. Mỗi năm có 800.000 chết vì tự tử. Và trầm cảm là lý do thứ 2 gây ra cái chết ở người 15 – 29 tuổi.

Nếu bạn thấy các dấu hiệu như sau kéo dài trên 2 tuần thì cần đi gặp bác sĩ.

  1. Dấu hiệu chính:
  • Khí sắc trầm uất (trầm cảm)
  • Mất hứng thú hoặc không thấy sự hài lòng

Có 1 trong 2 dấu hiệu này suốt cả ngày và kéo dài nhiều ngày

2. Các dấu hiệu khác và bạn nhận thấy có ít nhất 4 trên 7 dấu hiệu sau

  • Thay đổi trọng lượng cơ thể đáng kể (tăng hoặc giảm)
  • Mất ngủ hoặc ngủ quá nhiều
  • Bồn chồn (kích động) hoặc trở nên chậm chạp, thờ ơ
  • Mệt mỏi hoặc cảm thấy mất năng lượng
  • Cảm thấy thiếu giá trị, hoặc thấy tội lỗi thái quá
  • Giảm thói quen suy nghĩ hoặc khả năng tập trung
  • Suy nghĩ về cái chết, có ý nghĩ tự tử nhưng không có kế hoạch cụ thể hoặc mưu toan tự sát hoặc có kế hoạch chi tiết để tự sát.

Nhẹ: 1 dấu hiệu chủ yếu + 4 dấu hiệu khác

Trung bình: ít nhất 1 dấu hiệu chủ yếu + 6 dấu hiệu khác

Nặng: ít nhất 1 dấu hiệu chủ yếu + 7 dấu hiệu khác.

Nhưng có nhiều khi, trầm cảm là một chiếc mặt nạ mà ấn giấu đằng sau các vấn đề khác (như rối loạn hưng trầm cảm, loạn thần…) nên việc chẩn đoán thuộc về nhà chuyên môn, chứ không phải là tự chẩn bệnh.

Câu hỏi:

Đối với đời sống hàng ngày, thì làm thế nào để nhận biết được là chúng ta đang bắt đầu bị trầm cảm? Qua thái độ, hành vi, thói quen sống? Hay chúng ta cần phải đi đến bác sĩ tâm lý để họ khám và chẩn đoán?

Trả lời:

Trầm cảm không phải là một sự khó ở hay cơn trầm uất nào đó, đó là một căn bệnh được được đặt trưng bởi các triệu chứng cụ thể.

  • Ở bình diện tâm trí, nỗi buồn bã nặng nề, mất đi cảm giác tự tôn về bản thân, suy giảm sự chú ý và tập trung, và có cả những suy nghĩ tiêu cực và tự hủy hoại.
  • Ở bình diện cơ thể, trầm cảm có thể là nguyên nhân gây ra sự mệt mỏi trường diễn, mất ngon miệng, hoặc suy giảm hứng thú. Ngoài ra, nó có thể là nguyên nhân của các cơn đau, thường gặp nhất là cơn đau đầu.
  • Người trầm cảm cũng dần trở nên chậm chạp trong mọi khía cạnh của đời sống hàng ngày: hoạt động tư duy, vận động thể chất, đời sống xã hội và cảm xúc.

Nhớ rằng, các biểu hiện đó kéo dài không ngừng trong ít nhất 2 tuần.

Ngoài ra, bạn có thể trả lời các câu hỏi sau:

  • Bạn có cảm thấy nỗi buồn bất thường và cứ thường trực không ngừng trong bạn?
  • Bạn không còn hứng thú trong việc thực hiện các hoạt động thường ngày (làm việc, giải trí…)?
  • Bạn cảm thấy kiệt sức, không còn năng lượng?
  • Bạn thấy cân nặng của mình thay đổi nhanh một cách không mong muốn (tăng hoặc giảm cân)?
  • Bạn có vấn đề với giấc ngủ, như khó vào giấc ngủ, thức dậy giữa đêm, hoặc muốn ngủ nhưng trằn trọc mà không thể nghỉ ngơi được?
  • Bạn thấy mình khó tập trung?
  • Bạn có xu hướng thấy mình kém cỏi, thiếu tự tin vào bản thân?

Nếu bạn chỉ trả lời có cho một trong các triệu chứng thì không đáng lo lắng gì. Nhưng nếu bạn trả lời có cho nhiều câu hỏi, và kéo dài hơn 2 tuần, thì hãy tìm nói chuyện với bác sĩ.

Câu hỏi:

Theo chị thì những nguyên nhân nào đưa đến tình trạng trầm cảm ở du học sinh? ( khách quan hay chủ quan?)

Trả lời:

Người ta không thể biết rõ được chính xác điều gì gây ra trầm cảm, nhưng khả năng rất nhiều trầm cảm là kết quả của tương tác phức tạp giữa các yếu tố xã hội, tâm lý và sinh học – bao gồm các câu chuyện về di truyền, các sự kiện diễn ra trong đời sống, môi trường sống và thói quen của con người.

  • Di truyền, mặc dù người ta có nghiên cứu về các tác động về di truyền trên trẻ sinh đôi, người ta có các bằng chứng rằng trầm cảm có yếu tố di truyền, mặc dù không tìm ra được gen cụ thể nào liên quan đến căn bệnh này. Mặt khác, những thành viên ở (các) thế hệ trước bị trầm cảm cũng có thể là một yếu tố nguy cơ.
  • Sinh học: người ta thấy sự thiếu hụt hoặc mất cân bằng của một số chất dẫn truyền thần kinh trong não bộ của người bị trầm cảm, nhất là serotonine. Sự mất cân bằng này gây cản trở cho các noron thần kinh giao tiếp với nhau. Chiều ngược lại, sự gián đoạn của các hormon cũng góp phần tăng trầm cảm.
  • Môi trường và các thói quen sống: những thói quen xấu (hút thuốc, uống rượu, ít vận động, xem ti vi quá nhiều, các trò chơi điện tử…) và các điều kiện sống (đời sống kinh tế bấp bênh, căng thẳng, cô lập xã hội…) là những thứ gây hại sâu sắc tới trạng thái tinh thần. Ví dụ, cộng dồn sự căng thẳng trong công việc có thể dẫn tới kiệt sức trong nghề nghiệp, và rồi không xa là trầm cảm.
  • Các sự kiện diễn ra trong đời sống: mất người thân, ly dị, bệnh tật, mất việc, hay bất kỳ sang chấn nào để có thể mở đường cho trầm cảm. Hoặc, việc chữa trị không đúng cách, hay những trải nghiệm sang chấn thời thơ ấu khiến cho con người nhạy cảm hơn với trầm cảm, bởi vì chúng phá hủy các chức năng của một vài gen có liên quan đến căng thẳng.

Đến lượt nó, trầm cảm sẽ làm cho cá nhân đó nhiều căng thẳng hơn, rối nhiễu các chức năng, và làm trầm trọng hơn hoàn cảnh sống của họ, và rồi trầm cảm lại tiếp tục nặng nề hơn.

Ngoài ra cũng cần phải nhắc tới rằng có một sự liên phụ thuộc giữa trầm cảm và sức khỏe thể chất. Ví dụ, bệnh tim mạch có thể dẫn tới trầm cảm, và ngược lại, trầm cảm có thể dẫn tới bệnh tim mạch.

Đối với du học sinh cũng không ngoại lệ, chúng ta cũng cần xem xét các tác động khác nhau tới cá nhân người đó, việc xem xét đó một mặt là trợ giúp cho việc hồi phục khỏi trầm cảm, một mặt là mang tính dự phòng, giúp cá nhân đó nhận thức và đương đầu, chăm sóc sức khỏe tâm trí tốt hơn.

Câu hỏi:

Cá tính của họ có thay đổi theo môi trường? Trầm cảm là do họ hay do môi trường? Có phải ai cũng phải trải qua giai đoạn này khi đi du học?

Trả lời:

Việc đi du học được xem như một sự kiện quan trọng trong đời sống: con người bị “lấy ra” khỏi thói quen cũ và bị “ném” vào một môi trường mới, cho dù họ có háo hức đến đâu, chuẩn bị tâm thế kỹ lưỡng thế nào, thì việc bỡ ngỡ và thích nghi là không tránh khỏi. Họ cần thời gian, và cả trải qua những thử thách.

Cũng chính cái tiến trình gia nhập, thích nghi đó gây ra các “trục trặc” ở những người có những yếu tố nhạy cảm sẵn và/hoặc không thành công trong việc hòa mình vào môi trường mới. Có nhiều điều phải đối mặt, phải cố gắng để hình thành nề nếp và chịu trách nhiệm với những nghĩa vụ mình mang, những công việc cũng như những mơ ước, hy vọng.

Trầm cảm có thể là một trong các biểu hiện của “trục trặc” đó.

Câu hỏi:

Có nên giấu hay không tình trạng của mình?

Trả lời:

Giấu ở đây là giấu khỏi ai, người khác hay giấu khỏi chính mình?

Việc giấu khỏi chính mình là điều nguy hiểm, bởi chúng ta không nhận ra vấn đề mình đang mang và tìm ra cách thức đối phó phù hợp.

Còn việc bạn muốn nói vấn đề của mình với người khác, thì điều quan trọng là bạn muốn nói với ai (ý nói về mối quan hệ tin cậy), và tự đảm đương được nỗi thất vọng nếu chia sẻ mà không được đón nhận hay không? Bạn có quyền quyết định việc chia sẻ sự riêng tư của mình.

Xét về khía cạnh thái độ đối với trầm cảm.

Chính bởi vì nếu mình cởi mở với các giả thiết về sức khỏe tâm trí – liệu mình có đang lo lắng thái quá, liệu mình có đang mắc một khó khăn tâm lý nào đó, liệu mình có đủ hiểu biết hoặc đủ khách quan để nhận diện vấn đề nào đó mình đang “ngờ ngợ” (lờ mờ) nó có ở trong mình, liệu mình có thể chia sẻ với ai để giúp mình giải tỏa băn khoăn của mình… thì bạn sẽ có nhiều cơ hội để hồi phục sớm khỏi rối nhiễu tâm lý nào đó. Có nhiều khi, việc nhận diện và điều trị đúng cách, bạn sẽ sớm quay lại đời sống với cả những niềm vui và những thử thách của nó, ngược lại, bạn sẽ mất thêm cơ hội và cần nhiều nguồn lực để đối phó với vấn đề hơn.

Một khía cạnh khác không kém phần quan trọng, đó là khi mình quan sát thấy ở người khác có các dấu hiệu của trầm cảm. Sẽ tùy từng mối quan hệ, tùy tính cách, tình huống của người kia, và tùy khả năng của mình mà mình có thể:

  • Đóng vai trò lắng nghe, đón nhận người kia – bởi hẳn họ đang có nỗi buồn, một nỗi chịu đựng nào đó khiến họ bối rối trong việc huy động các nguồn lực để chăm sóc mình.

Cho họ thông tin về sức khỏe tâm trí, hướng họ tới nhận thức để họ có thể nhận ra, và tìm cách thức chữa trị phù hợp.

Câu hỏi:

Những hệ lụy mà trầm cảm mang lại?

Trả lời:

Trầm cảm để lại hậu quả trên nhiều lĩnh vực khác nhau của đời sống:

  • Lĩnh vực sức khỏe: có nhiều nghiên cứu chỉ ra mối liên quan giữa trầm cảm và việc xuất hiện hay phát triển các bệnh tật thể chất. Người ta liệt kê ra các bệnh phổ biến như: tim mạch, đái tháo đường, bệnh truyền nhiễm, khó khăn về tình dục, bệnh tâm thể (mệt mỏi triền miên, cơ xương khớp, rối loạn tiêu hóa…). Ngoài ra cũng có thể kể đến các khó khăn đi kèm trầm cảm: rối loạn lo âu, sự phụ thuộc (rượu, ma túy, thuốc hướng thần).
  • Lĩnh vực lao động: OMS (tháng 3/2017) đã đánh rằng trầm cảm là nguyên nhân số 1 gây ra gánh nặng bệnh tật và mất khả năng lao động trên toàn thế giới. Trầm cảm khiến người lao động giảm hiệu suất và tăng các xung đột trong mối quan hệ nơi làm việc. Mặc dù ta đã biết mất việc có thể mở cánh cửa cho trầm cảm, thì ngược lại, trầm cảm cũng có thể gây mất việc.
  • Lĩnh vực quan hệ xã hội: người trầm cảm dần ít các giao lưu gặp gỡ, họ có xu hướng phóng đại các suy nghĩ tiêu cực, hạ thấp giá trị bản thân. Họ thu rút dần khỏi các mối liên hệ – sự cô lập này lại tạo ra một cái vòng luẩn quẩn ma quái – khiến bệnh trầm cảm càng trầm trọng hơn.
  • Lĩnh vực gia đình: chất lượng mối quan hệ gia đình cũng giảm sút bởi sự thay đổi các đặc điểm tích cực trước đây: khả năng lắng nghe, khả năng đón nhận – cởi mở, khả năng thích ứng; thay vào đó là sự cáu kỉnh, suy giảm sự quan tâm, mất dần các hứng thú. Những điều đó dẫn tới bầu không khí gia đình căng thẳng, tỷ lệ li dị tăng lên.

Trầm cảm không được chăm chữa kịp thời và đúng cách, có thể dẫn tới cái chết.

Câu hỏi:

Có nên khuyến khích dùng thuốc khi bị chẩn đoán là trầm cảm? Từ mức độ nào trở lên thì nên dùng thuốc?

Trả lời:

Không dùng thuốc khi không có chỉ định của bác sĩ.

Câu hỏi:

Ngoài việc dung thuốc thì chúng ta nên làm gì để có thể kiểm soát được tình trạng trầm cảm của mình?

Trả lời:

  • Nhận sự hỗ trợ từ nhà chuyên môn, từ người thân.
  • Có thể kết hợp trị liệu tâm lý.
  • Người ta cũng thường nói tới các liệu pháp y học nhẹ nhàng: thảo dược, châm cứu, vi lượng đồng căn, thiền, yoga…
  • Khuyến khích sinh hoạt nề nếp và chế độ dinh dưỡng phù hợp.
  • Khuyến khích vận động cơ thể, thể dục thể thao
  • Khuyến khích đi ra ngoài, gặp gỡ mọi người
  • Nói chuyện, chia sẻ với người tin cậy
  • Tìm lại các thú vui trước đây, dần dần có lại hứng khởi trong các hoạt động đời sống.

Câu hỏi:

Nếu phát hiện ngay từ đầu, nghĩa là chúng sớm nhận ra những dấu hiệu bất thường về bệnh trầm cảm, thì giải pháp là gì?

Trả lời:

Cuộc sống luôn là phép cộng của các mâu thuẫn, các thử thách, đòi hỏi chúng ta phải nỗ lực và vượt qua. Cuộc sống cũng là một cuộc phiêu lưu, chúng ta không thể biết trước được chuyện gì sẽ xảy ra để chuẩn bị ứng phó. Vậy thì khó khăn là chuyện bình thường, và những chao đảo là điều dễ xảy đến, nhưng cái chúng ta cần có là không để mình đổ ngã

Có một cách dự phòng cần thiết, đó là xây dựng một cái Tôi vững vàng với những chiến lược tư duy lành mạnh, trưởng thành, và những kiến thiết tâm trí vững chắc. Với một cái Tôi cứng cáp, thì đồng thời sức đề kháng tâm lý cũng tăng lên, cái Tôi đó sẽ nhạy cảm với bản thân mình để có thể nhìn thấy những điều đang đương đầu, cái Tôi đó sẽ tự chủ để nhận trách nhiệm chăm sóc bản thân và huy động các nguồn lực nếu cần.

Câu hỏi:

Ai giúp bệnh nhân thoát ra khỏi trạng thái tâm lý trầm cảm ngay từ đầu? Điều kiện cần và đủ của việc ý thức cá nhân và sự giúp đỡ của cộng đồng?

Trả lời:

Khi ở tuổi trưởng thành, mà chúng ta vẫn cảm thấy yếu ớt đứng trên đôi chân của mình, thì rất có thể bạn chưa có một cái Tôi đủ tự tôn, đủ kiến thiết thuận lợi, vì những lý do mà chúng ta không thể biết hết được. Và trách nhiệm vẫn thuộc về bạn trong việc tự bù đắp mình những điều thiếu, tự hồi phục khỏi những đau khổ, chịu đựng, để có thể thích nghi với môi trường sống xung quanh, để có thể hiện thực hóa những mơ ước của mình.

Công việc này đòi hỏi nhiều thời gian, và nó được tiến hành qua nhiều cách thức:

  • Đọc sách để có thông tin, kiến thức
  • Trao đổi với những người có kinh nghiệm,
  • Thảo luận với bạn bè về những thắc mắc, những trải nghiệm.
  • Dám dấn thân trong các hoạt động sống, đồng thời giữ sự sáng suốt để cởi mở và học hỏi

Nếu cần, có thể theo đuổi một tiến trình chăm sóc tâm lý cá nhân để có thể tường tỏ hơn câu chuyện bản thân mình.

Câu hỏi:

Trầm cảm có khả năng quay lại hay không? Lý do? Giải pháp?

Trả lời:

Có, trầm cảm có thể tái phát.

Lý do có thể cũng giống như sự khởi phát, là tổ hợp từ các yếu tố cá nhân, môi trường và đời sống. Ngoài ra cần quan tâm đến quá trình điều trị trước đây: liệu có dừng thuốc khi chưa có chỉ định của bác sĩ, hoặc uống thuốc không đúng liều. Người từng mắc trầm cảm cần phải là “chuyên gia” về bệnh trong mối quan hệ với chính bản thân mình: duy trì một nhịp sống lành mạnh, hiểu về căng thẳng và cách thức đối mặt với căng thẳng, cần tránh sự cô lập và duy trì mạng lưới giúp đỡ, giữ một đời sống cân bằng và nhạy cảm với những phản ứng mang tính trầm cảm để phòng ngừa tái phát.

Cần chú ý tới các dấu hiệu sau để phòng ngừa tái phát:

  • Khó tập trung hoặc khó hoàn thành công việc
  • Cảm thấy thiếu năng lượng
  • Mất tự tin
  • Nhạy cảm thái quá
  • Có những mối bận lòng thái quá
  • Xu hương lo lắng
  • Khó đưa ra quyết định mặc dù là đơn giản
  • Giấc ngủ thay đổi, ăn uống thay đổi

Câu hỏi:

Chúng ta cần thời gian bao lâu để có thể kiểm soát được tình trạng này?

Trả lời:

Tùy từng người, tùy từng tình huống. Góc nhìn của tôi, một nhà tâm lý, thì không giống như các bác sĩ tâm thần – họ quan tâm tới chẩn bệnh và kê thuốc, tôi quan tâm tới nỗi chịu đựng của con người và khả năng con người đối diện với những điều không như ý, những mất mát. Cũng có thể, nỗi đau khổ đó mang tính sự vụ, thì khi có người hỗ trợ tâm lý hoặc khi thay đổi các yếu tố trong sự vụ đó, họ sẽ vượt qua nhanh, có thể trong vài tuần. Nhưng nếu nỗi khổ mang tính hoàn cảnh sống, hoặc liên quan tới kiểu nhân cách con người, thì có lẽ cần nhiều thời gian hơn nhiều.

Thay lời kết luận:

Hãy tự biết mình, và biết huy động các nguồn lực khi cần thiết!

Nhân đây, tôi xin giới thiệu nội dung về thảo luận nhóm online (group de parole) với chủ đề Các cơ chế phòng vệ của tâm trí con người + Kỹ năng gia nhập cộng đồng. Với nội dung này, tôi mong muốn cung cấp kiến thức, phương tiện để mỗi người tự hiểu về các chiến lược tâm trí giúp mình cân bằng, bổ sung những kiến thiết tâm trí để củng cố cái Tôi chủ thể, nhận diện hình ảnh tâm lý của mình và lựa chọn những thay đổi mình muốn. Các bạn có thể tham khảo ở đây để biết thêm thông tin:

https://www.facebook.com/tamlydoisong/posts/2162991257113512?__tn__=K-R

Ẩm thực – The Exquisite Boxed Meals of Japan’s Train-Station Kiosks

Ekiben offers a taste of the country’s regional delicacies.

Train-shaped treats.

THE TŌKAIDŌ SHINKANSEN, JAPAN’S FAMOUS bullet-train line, flashes past futuristic skyscrapers, Shinto shrines, and lush paddy fields on its 180-miles-per-hour dash from Tokyo to Osaka. This time-defying bolt is vanquished only by the majesty of placid, cloud-cloaked Mt. Fuji, the brief sight of which makes time stand still for a serene, spectacular moment. To commemorate this sight, which occurs around 45 minutes after leaving Tokyo, many passengers unwrap boxes of food bought at station kiosks or from train attendants.

Called ekiben, a portmanteau combining eki (the Japanese word for “station”) and ben (short for bento, or boxed meal), these boxed meals are as numerous as the country’s train stations. Coming from Tokyo, one might dig into the cosmopolitan capital’s diverse offerings: fried chicken, shrimp tempura, macaroni salad, salmon onigiri (rice balls), steamed carrots shaped like flowers, and a bite of cake, all served in a bento modeled after the shinkansen. Passengers coming from Osaka might choose takoyaki, the city’s famous fried octopus dumplings, or takomusu, a takoyaki and musubi (rice ball) combo.

Seasonal, locally-sourced little bites of food that look like jewels.
Seasonal, locally-sourced little bites of food that look like jewels. MOREGALLERY/SHUTTERSTOCK

Ekiben is a bite-size representation of Japan’s food culture, portioned out in compartments of beautifully designed bentos that resemble gift boxes. Most contain pieces of chicken, cubes of breaded or grilled fish, tempura, an omelette, and a vegetable assortment of pickled daikon or seaweed arranged around balls of rice with a sprinkling of black sesame or nori. From this basic template (known as makunouchi, meaning “between act” and harkening to the bento served during intermission at kabuki and Noh shows in the Edo period), ekiben expands to include regionally specific novelties. At Hokkaido, for instance, this might mean celebrating the island’s cherished Pacific flying squid. Hokkaido’s Mori Station offers ikameshi (squid stuffed with a nub of rice and cooked in a special sauce), a dish that became famous during the Second World War when rice was scarce.

Ekiben has been part of Japanese rail travel almost since workers laid the earliest tracks. The first Japanese rail line, from Tokyo to Yokohama, began service in 1872. By 1885, records note, vendors were selling rice balls stuffed with pickled plums in bamboo leaf wrappers at Utsunomiya Station. By the turn of the century, a rapidly expanding rail network was matched in pace by the appearance of ekiben stalls selling boxes of local delicaciestai meshi (sea bream rice) at Shizuoka station, ayu (fresh river trout) sushi at Yamakita. Initially, vendors peddled ekiben out of trays, coming right up to the train window to eager customers. With the advent of air-conditioned coaches, the call of the ekiben vendor has all but disappeared. Now passengers make a steady canter to ekiben stalls on the station platform during scheduled train stops—a feat that requires speed and hustle. Fortunately, train attendants also sell ekiben from pushcarts.

Ekiben display at Kyoto station.
Ekiben display at Kyoto station. CHON KIT LEONG / ALAMY

It’s not just the food—ekiben’s beautiful packaging also evokes the region where it was made. In Hyōgo Prefecture, known for the traditional practice of catching octopus in a takotsubo, an earthen pot designed specifically for cephalopod nabbing, the hipparidako meshiekiben is a rice, octopus, conger eel, and vegetables dish served in a miniature takotsubo. In Okayama, the most popular ekiben references Momotarō, or peach boy, a local folkloric hero thought to have emerged out of a peach. The bento is shaped like a peach and the wrapper features an artistic rendition of Momotarō. Each ekiben box is a souvenir, and travelers often bring famous regional ekiben home as gifts.

In contrast to the dreary sameness of fast food, ekiben changes to incorporate seasonal ingredients. Springtime travelers might look forward to salt-preserved cherry blossoms with rice. Conger eel and rice ekiben appear in the summer, replacing winter’s oyster rice (kaki meshi). While you’d need to travel endlessly by train to sample all of the country’s ekiben, Tokyo Station’s retail behemoth Ekibenya Matsuri(meaning ekiben festival), sells 170 kinds that feature local delicacies from all over Japan.

Some ekiben come in traditional serveware, such as this porcelain pot.
Some ekiben come in traditional serveware, such as this porcelain pot. COLIN HUI/SHUTTERSTOCK

Ekiben is equally popular among Japanese and foreign tourists. Fans have their own ekiben wrapper collections; devotees can enjoy ekiben magazines and comic strips; and the official vendor of the Japanese rail pass (similar to the Eurail pass) has tips on how best to enjoy ekiben on their website.

A fast food prepared slowly, with local, seasonal ingredients, and consumed while meditatively pondering passing landscapes, ekiben is a cultural artifact, an invitation to take a slice of Japan’s culinary bounty as a flavorful memento of the pleasures of exploration.

By

Full link: https://www.atlasobscura.com/articles/japan-train-food?utm_source=Gastro+Obscura+Weekly+E-mail&utm_campaign=74375c9611-GASTRO_EMAIL_CAMPAIGN_2019_06_29&utm_medium=email&utm_term=0_2418498528-74375c9611-70327933&ct=t(GASTRO_EMAIL_CAMPAIGN_2019_06_29)

Ẩm thực – The 15 Best Vitamin E-Rich Foods

You have a lot of options.

The 15 Best Vitamin E-Rich Foods

When you think of vitamin E, chances are you’ve heard about using it topically on your skin. But did you know that vitamin E is actually an incredibly important nutrient used within the body for a variety of purposes? The problem with trying to get enough is that it can be tough to find because not a lot of foods contain it.

Vitamin E is a fat-soluble vitamin, so it’s best to eat vitamin E-containing foods with a fat source to help your body absorb and use the vitamin. “The recommended daily allowance of vitamin E for men and women is 15 mg. During lactation, women need 19 mg. People who smoke may have higher requirements, but no specific recommendations have been made,” says Sheli Msall, RD.

What are the health benefits of vitamin E?

One of the most important roles vitamin E plays in your body is as a powerful antioxidant, which means it protects your body from a variety of potentially damaging substances that you encounter in your day-to-day life. According to Msall, this includes free radicals that can enter the body from UV light and/or air pollution.

In addition to protecting your body from free radicals, vitamin E also helps promote cell health and improve cholesterol levels.

“Vitamin E may also affect cholesterol production, lower LDL cholesterol, reduce plaque buildup in arteries, suppress tumor growth, lower the risk of certain cancers, and lower the risk of coronary heart disease,” Msall says. And that’s not even all the benefits. Vitamin E can also promote eye health by preventing cataracts and age-related macular degeneration, help protect against iron toxicity, and help with blood sugar management, Msall says.

Now that you know all of the benefits of vitamin E, just how exactly can you make sure you’re getting enough?

Try to incorporate some of these 15 vitamin E foods, ranked from the least rich sources to the highest, into your diet.

15

Eggs

Shutterstock

Vitamin E Content: Per 2 eggs, large: 1.05 milligrams, (7% DV)

Eggs may be simple, but they are packed with nutrition, so it’s not surprising that they contain 1.05 milligrams of vitamin E. In addition to vitamin E, eggs also contain protein, healthy fat, calcium, phosphorus, and vitamin D.

14

Avocado

Shutterstock

Vitamin E Content: Per ½ raw avocado: 1.34 milligrams, (8.9% DV)

Avocado is one of the most popular foods of the moment, and for good reason. Not only is avocado super tasty, but it contains a small amount of vitamin E, too. Try it smashed on toast, sliced with eggs, or even blended into a smoothie for an extra creamy and rich texture.

13

Broccoli

Shutterstock

Vitamin E Content: Per 1 cup, boiled: 1.13 milligrams, (7.53% DV)

Do we need another reason to love broccoli? The green veggie in the cruciferous family is not only a great source of vitamins A and K, but it also contains 1.13 milligrams of vitamin E.

And broccoli doesn’t have to be boring (looking at you plain, steamed broccoli). Try roasting it with your favorite seasonings, tossing it in the air fryer, or chopping it and adding it into your favorite dishes.

12

Peanuts

Shutterstock

Vitamin E Content: Per 1 oz, dry roasted and salted: 1.4 milligrams, (9.3% DV)

Love to snack on roasted peanuts? Not only are peanuts a great source of protein and fiber, but they also have a decent amount of vitamin E. If you’re not a fan of eating peanuts on their own, try incorporating them into sauces or dishes. Thai peanut sauce, anyone?

11

Red Pepper

Shutterstock

Vitamin E Content: Per 1 cup, raw: 2.35 milligrams, (15.6% DV)

Want a way to add some color and sweetness into your salads, snacks, and more? Try adding red bell peppers. They’re a great source of vitamin E, and they also contain vitamins A and C for an added nutritional boost.

10

Spinach

Shutterstock

Vitamin E Content: Per ½ cup, boiled: 1.87 milligrams, (12.4% DV)

Spinach is one way to get your daily dose of greens, as well as 12.4% of your daily value of vitamin E in just one half of a cup. Cooked spinach can easily be added into a variety of dishes, including quiche, frittata, pasta, soups, and more. Even better, spinach is also a great source of vitamins A and K.

9

Peanut Butter

Shutterstock

Vitamin E Content: Per 2 tbsp: 2.91 milligrams, (19.4% DV)

A peanut butter and jelly sandwich may be your go-to comfort food, but did you know that peanut butter is also a great source of vitamin E? Just one two-tablespoon serving gets you 19.4% of your daily value of vitamin E, plus seven grams of filling protein and almost two grams of fiber.

8

Hazelnuts

Shutterstock

Vitamin E Content: Per 1 oz: 4.26 milligrams (28.4% DV)

Hazelnuts are not only a great source of vitamin E; they’re also a good source of protein, potassium, and folate. Even though hazelnuts are often used in festive recipes or desserts, they definitely deserve a spot in your trail mix or snack lineup. Hazelnut butter is also a tasty treat you can enjoy on fruit, crackers, and other snacks.

7

Eel

Shutterstock

Vitamin E Content: Per 4 oz: 4.53 milligrams, (30.2% DV)

If you’re a fan of Japanese food or sushi, then chances are you’ve tried eel. If not, it might seem like a strange food to try. But don’t be too intimidated; the flavor is actually pretty subtle for seafood. And depending on how it’s cooked, eel can be a tasty and nutritious option.

6

Safflower Oil

Shutterstock

Vitamin E Content: Per 1 tbsp: 4.64 milligrams, (30.9% DV)

Safflower oil is another option for adding fat (and 30.9% of your daily value of vitamin E) to meals. The fat in safflower oil is mostly monounsaturated fat, which is the same type of fat found in olive oil.

Try drizzling safflower oil on salads or finished plates or use it to cook (at lower temperatures) like you would olive oil or another plant-based oil.

5

Sunflower Oil

Shutterstock

Vitamin E Content: Per 1 tbsp: 5.59 milligrams (37.26% DV)

Sunflower oil is a decent source of vitamin E, in addition to fat. Sunflower oil is commonly used in prepared foods or packaged foods and salad dressings. It’s one oil option you can try to get closer to your daily vitamin E needs.

4

Almonds

Shutterstock

Vitamin E Content: Per 1 oz, dry roasted: 6.78 milligrams (45.2% DV)

Whole almonds don’t pack quite as much vitamin E in one serving as almond butter, but it comes pretty close. One serving will get you 6.78 mg of vitamin E, almost half of your recommended daily value.

Almonds are a great snack that’s easy to carry around on the go. Or slice or chop them and add them into salads, baked goods, or other foods for extra crunch.

3

Sunflower Seeds

Shutterstock

Vitamin E Content: Per 1 oz, dry roasted: 7.4 milligrams (49.3% DV)

Sunflower seeds add texture, crunch, and saltiness to so many different meals. And they make a great snack on their own, too. Just a one-ounce serving gets you 37% of your recommended daily value of vitamin E. Try them as a topper on salads or soups, or toss them into trail mix.

2

Almond Butter

Vitamin E Content: Per 2 tbsp: 7.75 milligrams (51.6% DV)

Is there anything almond butter doesn’t make tastier? And, just one two-tablespoon serving packs over half of your day’s vitamin E needs. It also contains almost seven grams of protein and more than three grams of fiber, making this spread super nutritious and filling.

1

Wheat Germ Oil

Shutterstock

Vitamin E Content: Per 1 tablespoon: 20.32 milligrams (135% DV)

There’s more than 100% percent of your recommended daily value of vitamin E in just one tablespoon of wheat germ oil. Add it into a smoothie or other flavorful dishes, like soups or sauces, and you’ll never notice it’s there.

You might not hear about vitamin E as much as other vitamins, but it’s still a crucial part of a healthy diet. Fortunately, these 15 foods make it easy to incorporate vitamin E into your diet, and you can reap all of its nutritional benefits.

By MERCEY LIVINGSTON

Full link: https://www.eatthis.com/vitamin-e-foods/?utm_source=nsltr&utm_medium=email&utm_content=are-rice-cakes-healthy&utm_campaign=etntNewsletter

Kungfu – SELF DEFENSE 101 AVOID LOOKING LIKE A VICTIM

How do attackers choose their victims? James Field, a seventh-degree black belt in shotokan karate, has taught self-defense for four decades. During that time, he’s carefully studied how predators pick their prey.

“While in college, I worked in recreation centers and talked to young thugs,” Field recalls. “They told me they could simply look at certain people and see they were easy targets.

“There was something about these potential victims: their posture, demeanor, the way they walked. Many avoided [making] eye contact.” 

One way to prevent an attack, then, is to avoid looking like an easy victim. “Walk with energy and self-confidence,” James Field says. “Make brief eye contact with people you encounter, but don’t act aggressively and don’t try to stare them down.”

Your body language often reveals whether you’re a potential victim. Rest assured that the bad guys are watching you — always. If your efforts to avoid conflict fail and you must take physical action against someone, hit and run.

“If you do strike an attacker, don’t prolong the situation and exchange punches,” Field says. “End the fight quickly and leave.”

“Ideally, when you’re attacked, you’ll react automatically. The further you go in your shotokan training, the more your techniques will become reactions. They’ll become second nature to you. At the junior level of training, you learn basics. But when you graduate to the upper level, you learn the reaction of application.

“We don’t teach you how to fight per se. Rather, we teach you how to defend yourself.”

BONUS TIP NO. 1: Present Yourself with Confidence

“Be aware of the message your body sends to those around you. Like animals, human predators target those they consider to be the weakest or most vulnerable. Attackers search for women who appear frightened, confused or distracted. They look for women who walk with their head down and their hands stuffed in their pockets, or perhaps one who is overburdened with packages or distracted by children.

“Remember that attackers do not want to bait a fight; they want an easy mark. By walking with confidence and awareness — looking around and keeping your head up and your shoulders back — you will dramatically reduce the likelihood of becoming a target in the first place.”

— Meredith Gold, Black Belt Hall of Fame member

BONUS TIP NO. 2: Beware the Surprise Attack

“While it is impossible to prevent a true surprise attack, a street thug is rarely able to fulfill his plan clandestinely because of the requisite levels of patience, skill, timing and luck. However, many so-called surprise attacks work because of the inattentive nature of most people.

“Although true surprise attacks are relatively rare, the potential for them can be greatly reduced simply by remaining alert and aware. Pay attention to your surroundings. Career criminals are experts at picking good victims. By displaying a level of consciousness not usually found among the general public, you send a message that you are a hard target. Most would-be attackers will chose someone else. Remember that if you want to stay alive, you must first stay awake.”

— James E. Briggs, American combato

Full link: https://blackbeltmag.com/arts/japanese-arts/self-defense-101-avoid-looking-like-a-victim

Kungfu – KENPO LEGEND ED PARKER ON THE SECRETS OF SPEED

To understand karate techniques and how they function, you must have knowledge of physics. You must study the body and learn how the senses — through the principles of mass, speed, body alignment, angles, momentum, gravitational marriage, torque, focus, stability, power and penetration — can make the body function intuitively. An in-depth study of these principles of physics will also reveal the sophistication contained within basic techniques.

“He who hesitates, meditates in a horizontal position” is a statement I use to imply the need for prompt action. It is a statement referring to speed. “Do it now,” “I want it done this instant,” “You’d better be fast,” and “Be quick about it” are all phrases that imply speed or are intended to hasten velocity regardless of direction.

As we study these terms, we learn that they are concepts related to distance and time. By definition, speed equals the distance divided by the time it takes to move there.

Speed, however, goes beyond this definition. Like the Eskimo who uses a number of terms to describe types of snow, we too must distinguish and categorize speed to make it meaningful to the karate enthusiast.

There are three categories of speed: perceptual, mental and physical. However, while the categories are separated in order to analyze what speed entails, they function as one.

Perceptual Speed

Perceptual speed is the quickness of the senses in monitoring the stimulus they receive, determining the meaning of the stimulus and conveying the information to the brain so that mental speed can arrange the proper response.

To the karate practitioner, it is the feel or smell of trouble; a sound, sign or gesture that suggests trouble; the sight of an incoming strike; or the opportunity to attack or counterattack.

Speed of this type can be increased by maintaining alertness and by conditioning the senses to develop environmental awareness.

Mental Speed

Mental speed is the quickness of the mind to select appropriate movements to effectively deal with an incoming stimulus. Speed of this type can be increased only by practicing various karate techniques on a regular basis.

This involves learning the techniques to a point of total familiarity and instinctive response.

As you broaden your knowledge of combat alternatives and learn how to tap into the movements and concepts stored in your consciousness, the speed of your instinctive response increases.

Physical Speed

Physical speed is the quickness of physical movement — fluency in response to a stimulus, and the speed with which one executes a technique. Speed of this type can be increased through stretching, body conditioning and other methods of training.

Stretching exercises help increase elasticity, which automatically develops reach. Body conditioning prevents fatigue and allows a high level of speed to be maintained for longer periods of time.

Economy of Motion

Knowledge of the principle of economy of motion also contributes to speed. It helps you avoid erroneous angles and teaches you how to administer your strength.

This principle stresses the importance of being relaxed when striking, tensing only at the moment of impact; making one aware that time is crucial; using movements that follow direct angles and paths; eliminating “telegraphing” of techniques unless as a means of deceptive strategy; using continuity, flow and rhythm; responding to combat from natural postures; learning about target accessibility; and distance, or range.

In conclusion, while speed often enhances power, it is not the root of power. Synchronization of body mass and speed is the major ingredient that creates power.

By Ed Parker

Full link: https://blackbeltmag.com/arts/western-european-arts/kenpo-legend-ed-parker-on-the-secrets-of-speed

Collection – 18 Examples of Successful Co-Branding Partnerships (And Why They’re So Great)

co-branding-partnership-business-examples

Everyone has loyalties to their favorite brands, but there’s a good chance your favorite products are the result of two separate brands working together.

One of my own beloved childhood memories was a product of co-branding: Betty Crocker partnered with Hershey’s to include chocolate syrup in its signature brownie recipe.

There’s something brilliant about that co-branded product: It’s a fun way to marry two classic brands into one delicious experience for fans of baking and chocolate alike. In fact, these brands still create new co-branded products to this day.

Co-branding is a strategic marketing and advertising partnership between two brands wherein the success of one brand brings success to its partner brand, too. Co-branding can be an effective way to build business, boost awareness, and break into new markets, and for a partnership to truly work, it has to be a win-win for all players in the game. Both audiences need to find value — like chocolate-loving fans of Betty Crocker and Hershey’s.

There are a ton of great examples of co-branding partnerships out there. To show you what makes them so successful, we’ve curated a list of 13 examples of great co-branding partnerships to inspire you.

1. GoPro & Red Bull

Co-branding Campaign: Stratos

GoPro doesn’t just sell portable cameras, and Red Bull doesn’t just sell energy drinks. Instead, both have established themselves as lifestyle brands — in particular, a lifestyle that’s action-packed, adventurous, fearless, and usually pretty extreme. These shared values make them a perfect pairing for co-branding campaigns, especially those surrounding action sports.

To make the partnership work, GoPro equips athletes and adventurers from around the world with the tools and funding to capture things like races, stunts, and action sport events on video — from the athlete’s perspective. At the same time, Red Bull uses its experience and reputation to run and sponsor these events.

“GoPro camera technology is allowing us to complement the programming by delivering new athlete perspectives that have never been seen before,” said Sean Eggert, Red Bull’s director of sports marketing. The collaboration allows exclusive GoPro content to enhance both companies’ growth.

While GoPro and Red Bull have collaborated on many events and projects together, perhaps the biggest collaboration stunt they’ve done was “Stratos,” in which Felix Baumgartner jumped from a space pod more than 24 miles above Earth’s surface with a GoPro strapped to his person. Not only did Baumgartner set three world records that day, but he also embodied the value of reimagining human potential that define both GoPro and Red Bull.

2. Pottery Barn & Sherwin-Williams

Co-branding Campaign: Color Your Room

One of the biggest benefits of co-branding campaigns is the opportunity to expose your product or service to a brand new audience. That’s exactly what home furnishing store Pottery Barn and paint company Sherwin-Williams did when they partnered together back in 2013.

Together, the two brands created an exclusive product line of paints, and then added a new section of Pottery Barn’s website that helped customers easily select paint colors to complement their furniture choices.

pottery barn color your room.png

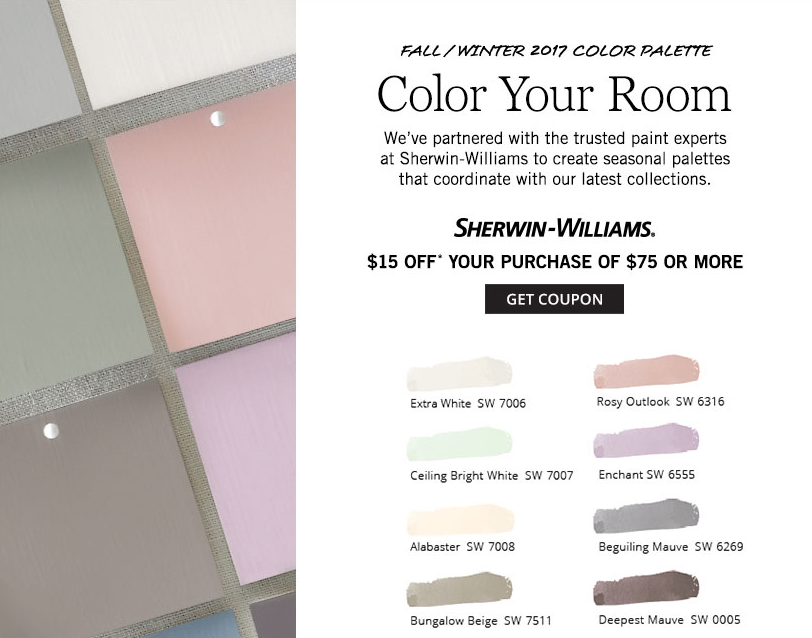
Source: Pottery Barn

Customers could coordinate paint colors with picture-perfect Pottery Barn furniture for a mutually beneficial partnership — and style assistance for both brands’ customers to boot. “Paint Landing,” Pottery Barn’s landing page for the partnership, contains helpful blog posts and how-to ideas for do-it-yourself painting and decorating.

3. Casper & West Elm

Co-branding Campaign: Test a Casper Mattress

You may have already heard of Casper — it’s an online mattress and bedding brand that sells mattresses in a box.

Casper mattress unboxing videos like this one have become a hit on YouTube, but despite the brand’s 100-day return policy, some shoppers might still be hesitant to buy a mattress without getting the chance to roll around in it first.

Enter West Elm, a high-end furniture company. Casper and West Elm partnered so shoppers could try out the comfy mattress before purchasing — and so West Elm could advertise its chic bedroom furniture.

west-elm-hero.jpg

Source: Casper

This is another example of a mutually beneficial co-branding partnership. It helps both brands appeal to a broader group of shoppers — after all, Casper doesn’t sell furniture, and West Elm doesn’t sell mattresses. It also provides shoppers with options — to try a mattress before buying, or to feel what it would be like sleeping in a bed frame.

4. Taco Bell & Doritos

Co-branding Campaign: Doritos Locos Tacos

When the Doritos Locos Taco was first introduced, it quickly became one of the most popular and widely recognized items in the fast food industry. Frito-Lay took Taco Bell’s crunchy taco recipe and gave the Locos Taco its special, signature twist: a Doritos shell. The two companies wanted to keep the shell as close to the original cheesy chips as possible, using the original corn masa recipe and coating it in that distinctive nacho cheese dust.

The taco was an immediate and explosive success: Taco Bell sold an estimated 1 billion units the first year its was introduced. 

Taco Bell and Frito Lay advertised the Doritos Locos Taco by wrapping the taco in a classic Doritos bag, reflecting the co-branding partnership and appealing to both brands’ audiences. The Doritos Locos Taco’s extraordinary success is yet another example of why co-branding can boost reach and sales for both brands.
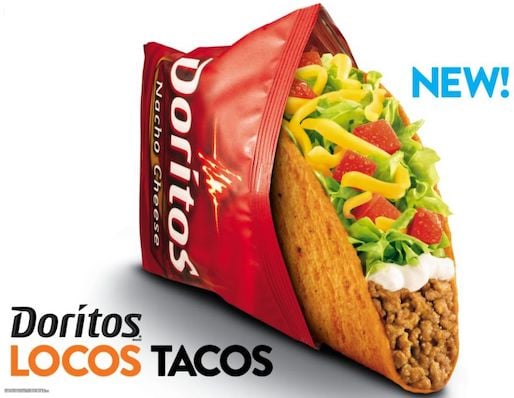
co-branding-partnership-doritos-taco-bell

Source: Taco Bell

5. Kanye and Adidas

Co-branding Campaign: Yeezy

Kanye West, best known for his Grammy-winning rap albums, partnered with Adidas to develop a high-end footwear line called Yeezy. The combination of Kanye’s personal brand and Adidas’ growing streetwear segment has made for robust company earnings and brand growth since it was introduced.

Kanye’s celebrity appeal benefits Adidas by creating buzz around its apparel, and the athletic-wear brand gives Kanye a well-established platform to build his high-end clothing line. One of the strongest draws of Yeezy — and most notably its shoes — is its exclusivity: Kanye’s celebrity status, extremely scarce roll-outs, and the high price tag make the lucky few to own Yeezy sneakers feel a little famous by association.

Adidas’ co-branding relationship with Kanye and the resulting cult-like Yeezy following led to a stellar year for the company: in 2019, Adidas’ net income climbed 19.5% to $1.9 billion.
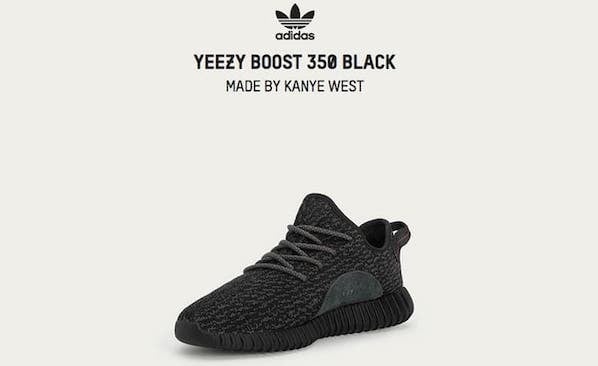
adidas-kanye-cobranding

Source: Yeezy

6. BMW & Louis Vuitton

Co-branding Campaign: The Art of Travel

Car manufacturer BMW and designer Louis Vuitton may not be the most obvious of pairings. But if you think about it, they have a few important things in common. If you focus on Louis Vuitton’s signature luggage lines, they’re both in the business of travel. They both value luxury. And finally, they’re both well-known, traditional brands that are known for high-quality craftsmanship.

These shared values are exactly why this co-branding campaign makes so much sense. In their partnership, BMW created a sports car model called the BMW i8, while Louis Vuitton designed an exclusive, four-piece set of suitcases and bags that fit perfectly into the car’s rear parcel shelf.

louis-vitton-bmw.jpg

Source: Louis Vuitton

Although the four-piece luggage set goes for a whopping $20,000, the price is right for the target customer, as the BMW i8 starts at $135,700. A price like that kind of makes that luggage set seem like a drop in the bucket.

Not only does the luggage fit perfectly size-wise, but its design and appearance fit perfectly with BMW’s image: sleek, masculine, and high-quality. Turns out both the luggage and some parts of the car’s interior use carbon fiber, strong-yet-light composite material.

“This collaboration with BMW i epitomises our shared values of creativity, technological innovation and style,” said Patrick-Louis Vuitton, head of special orders at Louis Vuitton. “Our craftsmen have enjoyed the challenge of this very special project, using their ingenuity and attention to detail to create a truly made to measure set of luxury luggage. This is a pure expression of the art of travel.”

7. Starbucks & Spotify

Co-branding Campaign: First-of-Its-Kind Music Ecosystem

Starbucks scaled up a premium coffee shop experience into a massive global brand, using music to create an ambience around its coffee. Spotify, a music streaming platform, has powered almost 25 billion hours of listening around the world. Starbucks and Spotify forged an innovative co-branding partnership to build a “music ecosystem”, offering artists greater access to Starbucks consumers and giving Starbuck access to Spotify’s expansive discography.

Through the initiative, Starbucks employees get a Spotify premium subscription, with which they can curate playlists (that patrons can access through the Starbucks Mobile App) to play throughout the day in the shop. This music ecosystem is designed to expand the coffeehouse environment that Starbucks is known for while giving artists greater exposure to Starbucks customers.

The “musical-ecosystem” partnership is mutually beneficial, an opportunity for the companies to reach the other’s audience without sacrificing their brand.
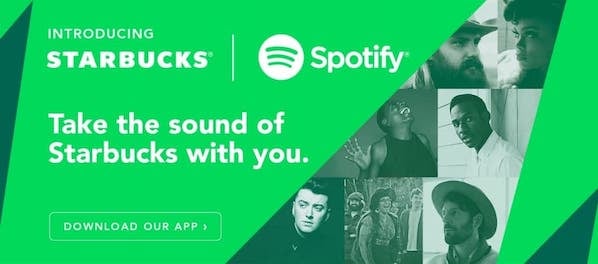
starbucks-spotify-cobranding-partnership

Source: Spotify

8. Apple & MasterCard

Co-branding Campaign: Apple Pay

Sometimes, co-branding partnerships aren’t just cool projects between two companies — they actually have practical value when the companies work together.

When Apple released the Apple Pay app, the brand effectively changed how people perform transactions. This app allows people to store their credit or debit card data on their phone, so they can use them without physically having the card with them. But in order for this app to succeed, it needs credit card companies to integrate with this technology. By the same token, credit card companies also face more competition themselves if they aren’t compatible with the latest consumer purchasing tool.

To get out ahead of its competition, MasterCard became the first credit card company to allow its users to store their credit and debit cards on Apple Pay. MasterCard not only showed support of a major consumer tech developer in this partnership — it evolved along with its own customers in how they choose to make purchases at the counter.
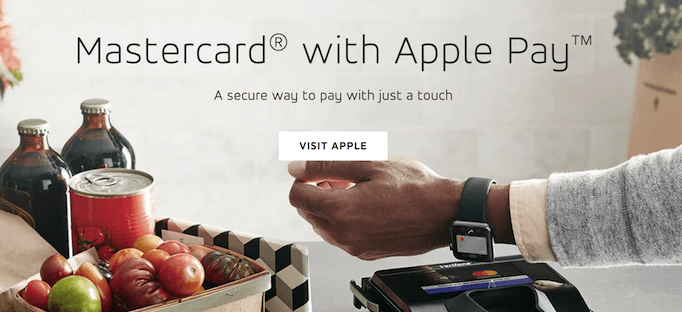
Co-branding partnership between Apple and MasterCard on Apple PaySource: MasterCard

9. Airbnb & Flipboard

Co-branding Campaign: Experiences

You’ve probably heard of Airbnb, the room-sharing application that allows you to find convenient lodging hosted by real people. But its newest partner, Flipboard, might not have been on your radar until now.

Flipboard is a news aggregator that collects news and topical content that users are sharing on social media, and allows you to “flip” through the material much like a social media feed. Well, Airbnb recently teamed up with Flipboard to create Experiences, which serve Airbnb users with lifestyle content tailored to their interests and shared by people with similar interests as the reader.

The ongoing campaign recently led to another co-created product called Trips, which allows Airbnb users to connect with hosts on common interests and actually book these experiences when traveling. This partnership is an impressive example of how businesses can connect their customers with information that caters to their individual interests and drive usage of the product as a result.
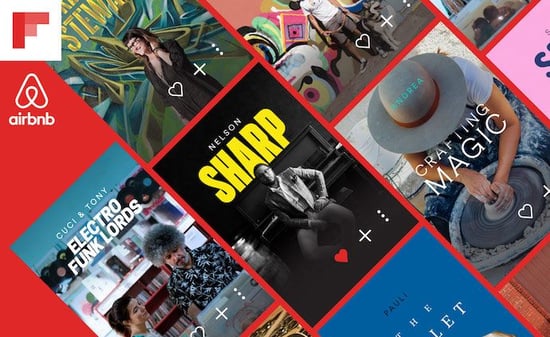
Co-branding partnership between Airbnb and Flipboard on ExperiencesSource: Flipboard

10. Uber & Spotify

Co-branding Campaign: Soundtrack for Your Ride

Music-streaming app Spotify partnered with ride-hailing app Uber to create “a soundtrack for your ride.” This is a great example of a co-branding partnership between two very different products with very similar goals — to earn more users.

Here’s how it works: When riders are waiting for an Uber ride, they’re prompted to connect with Spotify and become the DJ of their trip. Users can choose from their own playlists to determine what they’ll listen to.
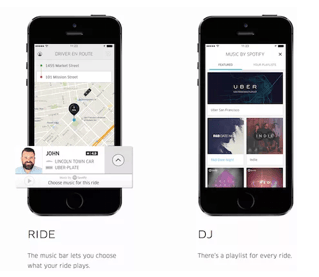
uber spotify.pngSource: The Verge

This smart co-branding partnership helps fans of Uber and Spotify alike enjoy better experiences thanks to the app. And they might be more interested in picking Uber and Spotify over competitors knowing they can enjoy their next ride listening to their favorite tunes.

11. Levi’s & Pinterest

Co-branding Campaign: Styled by Levi’s

Levi Strauss & Co. — one of the oldest and most recognized jean brands in the world — recently joined forces with Pinterest, a social platform where users pin posts they like to their user profiles. People often turn to Pinterest for fashion inspiration, making a co-branding partnership with Levi’s a natural partnership. Styled by Levi’s is a new initiative between Pinterest and Levi’s offers a “personalized styling experience,” or style insights tailored to each user’s tastes and preferences.

The partnership offers an authentic and individualized brand relationship, which is difficult to come by in an increasingly digital environment. Pinterest offers Levi’s a leading social platform with millions of users interested in visual offerings, and Levi’s meets these needs with digital personalization and visual-focused boards.

styled-by-levis-pinterest-cobranding

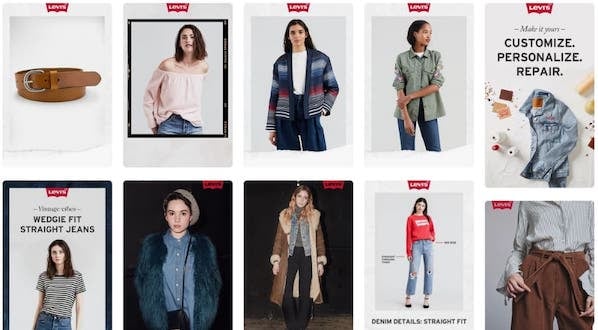
Source: Styled by Levi’s

12. BuzzFeed & Best Friends Animal Society

Co-branding Campaign: Emma Watson + Kittens

Some co-branding campaigns are more complicated than others. This example from BuzzFeed and Best Friends Animal Society is one of the simplest ones out there — and it goes to show a great co-branding effort doesn’t have to take months of planning or millions of dollars.

For this campaign, the folks at Best Friends Animal Society wanted to leverage BuzzFeed’s readership of over 200 million people. To do this, they partnered with the folks at BuzzFeed to set up and publish an article called, “We Interviewed Emma Watson While She Played With Kittens And It Was Absolutely Adorable,” which you can read here. The article is exactly what it sounds like: Harry Potter and Beauty and the Beast star Emma Watson answered fans’ questions while she played with cute kittens.

Emma Watson playing with kittens in a co-branding partnership between BuzzFeed and Best Friends Animal Society

Source: BuzzFeed

The article ends with a CTA advertising that the kittens featured in the video are, in fact, adoptable — a win-win for both partners.

13. Alexander Wang & H&M

Co-branding Campaign: High-End Fashion

Anyone who’s designer-conscious knows Alexander Wang and H&M aren’t exactly the same caliber when it comes to quality. Shoes by Alexander Wang tend to go for around $350 a pair, whereas shoes sold by H&M tend to go for more like $35 a pair. See what I mean?

But that discrepancy in pricing is exactly why the two brands decided to partner with one another. To support their brand positioning as trendy and fashionable, H&M has traditionally paired with high-end fashion brands to offer exclusive branded items for a limited time.

In exchange, those high-end brands — like Alexander Wang — can expose their brand name to “a new generation of potential consumers, who will increasingly aspire to owning more pieces from his high end collection,” writes Michelle Greenwald for Forbes.

alexander-wang-h-and-m.jpg

Source: Snobette

14. CoverGirl & Lucasfilm

Co-branding Campaign: Light Side and Dark Side Makeup

Whenever a new installment of the beloved “Star Wars” series is released in theaters, it causes global pandemonium, and the release of “Star Wars: Episode VII The Force Awakens” in 2015 was no exception. The series’ parent company, Lucasfilm, partnered with CoverGirl to capture a broader audience to get fans new and old excited about the movie’s release.

You might be wondering, “What do “Star Wars” and makeup have in common?” And the cleverness of this partnership is evident in the answer.

In the past, the space-age action movies were almost exclusively advertised and targeted toward men and boys. But in this day and age, that’s nonsense — because people of all genders can be interested in space exploration and makeup contouring alike.

The line was designed by famed makeup artistPat McGrath, and it features two styles: the Light Side and the Dark Side, which loyal “Star Wars” fans will recognize as the sides of good and evil in the movies.

This co-branding partnership was a win for both brand. Lucasfilm captured more attention and got CoverGirl shoppers (many of whom are young women) excited about the film’s release. And CoverGirl hopped on the “Star Wars” advertising bandwagon that took over the internet, stores, and TV leading up to the film’s release.

15. Amazon & American Express

Co-branding Campaign: Amazon Business American Express Card

Ecommerce giant Amazon is a global enterprise with millions of users and almost two million businesses that sell on their platform. Amazon is looking to improve the way small businesses sell on their platform, so they’ve partnered with American Express on a co-branded credit card.

The card will help users buy goods and services, but also provide enhanced data insights on their purchasing activity. American Express and Amazon share a commitment to help small businesses grow in the U.S., and by combining their efforts, the two companies can enhance their performance while building brand trust.

amexamazon-cobranding

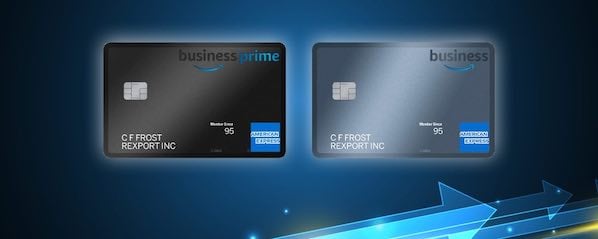
Source: Amazon Business
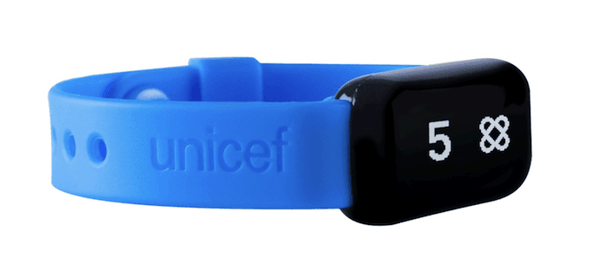
16. UNICEF & Target

Co-branding Campaign: Kid Power

If you have the chance to partner for a not-for-profit cause, it can pay off in multiple ways.

In 2015, Target partnered with UNICEF on a campaign called Kid Power, which committed Target to one of UNICEF’s sustainable development goals (SDGs). The retailer sold kid-friendly fitness trackers encouraging the wearer to complete various fitness activities, which ultimately helped deliver food packets to underprivileged children around the world.

By selling this fun, inexpensive fitness product, Target encourages children to embrace a healthy lifestyle and uses kids’ successes to supply underserved communities with the resources they need. It’s an ongoing partnership that generates awareness of global malnutrition, helps UNICEF meet its demanding SDGs, and opens up Target to a demographic of giving families they might otherwise have had access to.

By the way, you can get your child a Kid Power band here.

Co-branding partnership between UNICEF and Target on Kid Power Bands

17. Nike & Apple

Co-branding Campaign: Nike+

Athletic brand Nike and technology giant Apple have been working together since the early 2000s, when the first line of iPods was released.

The co-branding partnership started as a way to bring music from Apple to Nike customers’ workouts using the power of technology: Nike+iPod created fitness trackers and sneakers and clothing that tracked activity while connecting people to their tunes.
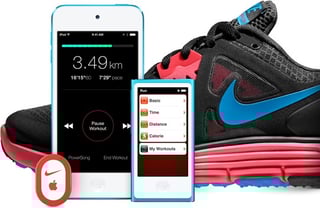
Nike+ shoe, iPhone, and iPod

Source: Apple

The partnership has since evolved to become Nike+ — which uses activity tracking technology built into athletic clothing and gear to sync with Apple iPhone apps to track and record workout data. Tracking transmitters can be built into shoes, armbands, and even basketballs to measure time, distance, heart rate, and calories burned.

It’s a genius co-branding move that helps both parties provide a better experience to customers — and with the popularity of fitness tracking technology, Nike+ is ahead of the curve by making it easy for athletes to track while they play.

18. Bonne Belle & Dr. Pepper

Co-branding Campaign: Flavored Lip Balm

Dr. Pepper-flavored lip balm. I mean, it’s genius.

Bonne Belle first debuted Lip Smacker, the world’s first flavored lip balm, in 1973, starting with flavors like strawberry, lemon, and green apple. Just two years laterin 1975, they’d forged their first flavor partnership with the timeless Dr. Pepper brand. The result? A lip balm flavor that’s been famous for decades among teenage girls.

If you’re thinking the connection between lip balm and Dr. Pepper is a little thin, consider the copy on one of their vintage ads: “It’s the super shiny lip gloss with lip-smacking flavor… just like the world’s most original soft drink.” And later, “From Bonne Belle of course: the cosmetics company that understands your taste.”

bonne-belle-dr-pepper.jpg

Source:Click Americana

By Sophia Bernazzani

Full link: https://blog.hubspot.com/marketing/best-cobranding-partnerships?utm_campaign=Marketing%20Blog%20-%20Daily%20Emails&utm_source=hs_email&utm_medium=email&utm_content=74142623

Collection – Machine Learning is Fun!

The world’s easiest introduction to Machine Learning

 This article is part of a series. Check out the full series: Part 1Part 2Part 3Part 4Part 5Part 6Part 7 and Part 8! You can also read this article in 日本語PortuguêsPortuguês (alternate)TürkçeFrançais한국어 , العَرَبِيَّة‎‎Español (México)Español (España)PolskiItaliano普通话Русский한국어 , Tiếng Việt or فارسی.

 I’ve written a new book based on these articles! It not only expands and updates all my articles, but it has tons of brand new content and lots of hands-on coding projects. Check it out now!

Have you heard people talking about machine learning but only have a fuzzy idea of what that means? Are you tired of nodding your way through conversations with co-workers? Let’s change that!


This guide is for anyone who is curious about machine learning but has no idea where to start. I imagine there are a lot of people who tried reading the wikipedia article, got frustrated and gave up wishing someone would just give them a high-level explanation. That’s what this is.

The goal is be accessible to anyone — which means that there’s a lot of generalizations. But who cares? If this gets anyone more interested in ML, then mission accomplished.


What is machine learning?

Machine learning is the idea that there are generic algorithms that can tell you something interesting about a set of data without you having to write any custom code specific to the problem. Instead of writing code, you feed data to the generic algorithm and it builds its own logic based on the data.

For example, one kind of algorithm is a classification algorithm. It can put data into different groups. The same classification algorithm used to recognize handwritten numbers could also be used to classify emails into spam and not-spam without changing a line of code. It’s the same algorithm but it’s fed different training data so it comes up with different classification logic.

This machine learning algorithm is a black box that can be re-used for lots of different classification problems.

“Machine learning” is an umbrella term covering lots of these kinds of generic algorithms.

Two kinds of Machine Learning Algorithms

You can think of machine learning algorithms as falling into one of two main categories —  and . The difference is simple, but really important.

Supervised Learning

Let’s say you are a real estate agent. Your business is growing, so you hire a bunch of new trainee agents to help you out. But there’s a problem — you can glance at a house and have a pretty good idea of what a house is worth, but your trainees don’t have your experience so they don’t know how to price their houses.

To help your trainees (and maybe free yourself up for a vacation), you decide to write a little app that can estimate the value of a house in your area based on it’s size, neighborhood, etc, and what similar houses have sold for.

So you write down every time someone sells a house in your city for 3 months. For each house, you write down a bunch of details — number of bedrooms, size in square feet, neighborhood, etc. But most importantly, you write down the final sale price:

This is our “training data.”

Using that training data, we want to create a program that can estimate how much any other house in your area is worth:

We want to use the training data to predict the prices of other houses.

This is called . You knew how much each house sold for, so in other words, you knew the answer to the problem and could work backwards from there to figure out the logic.

To build your app, you feed your training data about each house into your machine learning algorithm. The algorithm is trying to figure out what kind of math needs to be done to make the numbers work out.

This kind of like having the answer key to a math test with all the arithmetic symbols erased:

Oh no! A devious student erased the arithmetic symbols from the teacher’s answer key!

From this, can you figure out what kind of math problems were on the test? You know you are supposed to “do something” with the numbers on the left to get each answer on the right.

In , you are letting the computer work out that relationship for you. And once you know what math was required to solve this specific set of problems, you could answer to any other problem of the same type!

Unsupervised Learning

Let’s go back to our original example with the real estate agent. What if you didn’t know the sale price for each house? Even if all you know is the size, location, etc of each house, it turns out you can still do some really cool stuff. This is called  learning.

Even if you aren’t trying to predict an unknown number (like price), you can still do interesting things with machine learning.

This is kind of like someone giving you a list of numbers on a sheet of paper and saying “I don’t really know what these numbers mean but maybe you can figure out if there is a pattern or grouping or something — good luck!”

So what could do with this data? For starters, you could have an algorithm that automatically identified different market segments in your data. Maybe you’d find out that home buyers in the neighborhood near the local college really like small houses with lots of bedrooms, but home buyers in the suburbs prefer 3-bedroom houses with lots of square footage. Knowing about these different kinds of customers could help direct your marketing efforts.

Another cool thing you could do is automatically identify any outlier houses that were way different than everything else. Maybe those outlier houses are giant mansions and you can focus your best sales people on those areas because they have bigger commissions.

Supervised learning is what we’ll focus on for the rest of this post, but that’s not because unsupervised learning is any less useful or interesting. In fact, unsupervised learning is becoming increasingly important as the algorithms get better because it can be used without having to label the data with the correct answer.

Side note: There are lots of other types of machine learning algorithms. But this is a pretty good place to start.

That’s cool, but does being able to estimate the price of a house really count as “learning”?

As a human, your brain can approach most any situation and learn how to deal with that situation without any explicit instructions. If you sell houses for a long time, you will instinctively have a “feel” for the right price for a house, the best way to market that house, the kind of client who would be interested, etc. The goal of Strong AI research is to be able to replicate this ability with computers.

But current machine learning algorithms aren’t that good yet — they only work when focused a very specific, limited problem. Maybe a better definition for “learning” in this case is “figuring out an equation to solve a specific problem based on some example data”.

Unfortunately “Machine Figuring out an equation to solve a specific problem based on some example data” isn’t really a great name. So we ended up with “Machine Learning” instead.

Of course if you are reading this 50 years in the future and we’ve figured out the algorithm for Strong AI, then this whole post will all seem a little quaint. Maybe stop reading and go tell your robot servant to go make you a sandwich, future human.

Let’s write that program!

So, how would you write the program to estimate the value of a house like in our example above? Think about it for a second before you read further.

If you didn’t know anything about machine learning, you’d probably try to write out some basic rules for estimating the price of a house like this:

def estimate_house_sales_price(num_of_bedrooms, sqft, neighborhood):
  price = 0  # In my area, the average house costs $200 per sqft
  price_per_sqft = 200  if neighborhood == "hipsterton":
    # but some areas cost a bit more
    price_per_sqft = 400  elif neighborhood == "skid row":
    # and some areas cost less
    price_per_sqft = 100  # start with a base price estimate based on how big the place is
  price = price_per_sqft * sqft  # now adjust our estimate based on the number of bedrooms
  if num_of_bedrooms == 0:
    # Studio apartments are cheap
    price = price — 20000
  else:
    # places with more bedrooms are usually
    # more valuable
    price = price + (num_of_bedrooms * 1000) return price

If you fiddle with this for hours and hours, you might end up with something that sort of works. But your program will never be perfect and it will be hard to maintain as prices change.

Wouldn’t it be better if the computer could just figure out how to implement this function for you? Who cares what exactly the function does as long is it returns the correct number:

def estimate_house_sales_price(num_of_bedrooms, sqft, neighborhood):
  price = <computer, plz do some math for me>  return price

One way to think about this problem is that the  is a delicious stew and the ingredients are the , the  and the . If you could just figure out how much each ingredient impacts the final price, maybe there’s an exact ratio of ingredients to stir in to make the final price.

That would reduce your original function (with all those crazy if’s and else’s) down to something really simple like this:

def estimate_house_sales_price(num_of_bedrooms, sqft, neighborhood):
 price = 0 # a little pinch of this
 price += num_of_bedrooms *  # and a big pinch of that
 price += sqft *  # maybe a handful of this
 price += neighborhood *  # and finally, just a little extra salt for good measure
 price +=  return price

Notice the magic numbers in bold — ,,and . These are our . If we could just figure out the perfect weights to use that work for every house, our function could predict house prices!

A dumb way to figure out the best weights would be something like this:

Step 1:

Start with each weight set to 

def estimate_house_sales_price(num_of_bedrooms, sqft, neighborhood):
  price = 0  # a little pinch of this
  price += num_of_bedrooms *  # and a big pinch of that
  price += sqft *   # maybe a handful of this
  price += neighborhood *   # and finally, just a little extra salt for good measure
  price +=   return price

Step 2:

Run every house you know about through your function and see how far off the function is at guessing the correct price for each house:

Use your function to predict a price for each house.

For example, if the first house really sold for $250,000, but your function guessed it sold for $178,000, you are off by $72,000 for that single house.

Now add up the squared amount you are off for each house you have in your data set. Let’s say that you had 500 home sales in your data set and the square of how much your function was off for each house was a grand total of $86,123,373. That’s how “wrong” your function currently is.

Now, take that sum total and divide it by 500 to get an average of how far off you are for each house. Call this average error amount the  of your function.

If you could get this cost to be zero by playing with the weights, your function would be perfect. It would mean that in every case, your function perfectly guessed the price of the house based on the input data. So that’s our goal — get this cost to be as low as possible by trying different weights.

Step 3:

Repeat Step 2 over and over with . Whichever combination of weights makes the cost closest to zero is what you use. When you find the weights that work, you’ve solved the problem!

Mind Blowage Time

That’s pretty simple, right? Well think about what you just did. You took some data, you fed it through three generic, really simple steps, and you ended up with a function that can guess the price of any house in your area. Watch out, Zillow!

But here’s a few more facts that will blow your mind:

  1. Research in many fields (like linguistics/translation) over the last 40 years has shown that these generic learning algorithms that “stir the number stew” (a phrase I just made up) out-perform approaches where real people try to come up with explicit rules themselves. The “dumb” approach of machine learning eventually beats human experts.
  2. The function you ended up with is totally dumb. It doesn’t even know what “square feet” or “bedrooms” are. All it knows is that it needs to stir in some amount of those numbers to get the correct answer.
  3. It’s very likely you’ll have no idea  a particular set of weights will work. So you’ve just written a function that you don’t really understand but that you can prove will work.
  4. Imagine that instead of taking in parameters like “sqft” and “num_of_bedrooms”, your prediction function took in an array of numbers. Let’s say each number represented the brightness of one pixel in an image captured by camera mounted on top of your car. Now let’s say that instead of outputting a prediction called “price”, the function outputted a prediction called “degrees_to_turn_steering_wheel”. 

Pretty crazy, right?

What about that whole “try every number” bit in Step 3?

Ok, of course you can’t just try every combination of all possible weights to find the combo that works the best. That would literally take forever since you’d never run out of numbers to try.

To avoid that, mathematicians have figured out lots of clever ways to quickly find good values for those weights without having to try very many. Here’s one way:

First, write a simple equation that represents Step #2 above:

This is your .

Now let’s re-write exactly the same equation, but using a bunch of machine learning math jargon (that you can ignore for now):

θ is what represents your current weights. J(θ) means the ‘cost for your current weights’.

This equation represents how wrong our price estimating function is for the weights we currently have set.

If we graph this cost equation for all possible values of our weights for  and , we’d get a graph that might look something like this:

The graph of our cost function looks like a bowl. The vertical axis represents the cost.

In this graph, the lowest point in blue is where our cost is the lowest — thus our function is the least wrong. The highest points are where we are most wrong. So if we can find the weights that get us to the lowest point on this graph, we’ll have our answer!

So we just need to adjust our weights so we are “walking down hill” on this graph towards the lowest point. If we keep making small adjustments to our weights that are always moving towards the lowest point, we’ll eventually get there without having to try too many different weights.

If you remember anything from Calculus, you might remember that if you take the derivative of a function, it tells you the slope of the function’s tangent at any point. In other words, it tells us which way is downhill for any given point on our graph. We can use that knowledge to walk downhill.

So if we calculate a partial derivative of our cost function with respect to each of our weights, then we can subtract that value from each weight. That will walk us one step closer to the bottom of the hill. Keep doing that and eventually we’ll reach the bottom of the hill and have the best possible values for our weights. (If that didn’t make sense, don’t worry and keep reading).

That’s a high level summary of one way to find the best weights for your function called . Don’t be afraid to dig deeper if you are interested on learning the details.

When you use a machine learning library to solve a real problem, all of this will be done for you. But it’s still useful to have a good idea of what is happening.

What else did you conveniently skip over?

The three-step algorithm I described is called . You are estimating the equation for a line that fits through all of your house data points. Then you are using that equation to guess the sales price of houses you’ve never seen before based where that house would appear on your line. It’s a really powerful idea and you can solve “real” problems with it.

But while the approach I showed you might work in simple cases, it won’t work in all cases. One reason is because house prices aren’t always simple enough to follow a continuous line.

But luckily there are lots of ways to handle that. There are plenty of other machine learning algorithms that can handle non-linear data (like neural networks or SVMs with kernels). There are also ways to use linear regression more cleverly that allow for more complicated lines to be fit. In all cases, the same basic idea of needing to find the best weights still applies.

Also, I ignored the idea of . It’s easy to come up with a set of weights that always works perfectly for predicting the prices of the houses in your original data set but never actually works for any new houses that weren’t in your original data set. But there are ways to deal with this (like regularization and using a cross-validation data set). Learning how to deal with this issue is a key part of learning how to apply machine learning successfully.

In other words, while the basic concept is pretty simple, it takes some skill and experience to apply machine learning and get useful results. But it’s a skill that any developer can learn!

Is machine learning magic?

Once you start seeing how easily machine learning techniques can be applied to problems that seem really hard (like handwriting recognition), you start to get the feeling that you could use machine learning to solve any problem and get an answer as long as you have enough data. Just feed in the data and watch the computer magically figure out the equation that fits the data!

But it’s important to remember that machine learning only works if the problem is actually solvable with the data that you have.

For example, if you build a model that predicts home prices based on the type of potted plants in each house, it’s never going to work. There just isn’t any kind of relationship between the potted plants in each house and the home’s sale price. So no matter how hard it tries, the computer can never deduce a relationship between the two.

You can only model relationships that actually exist.

So remember, if a human expert couldn’t use the data to solve the problem manually, a computer probably won’t be able to either. Instead, focus on problems where a human could solve the problem, but where it would be great if a computer could solve it much more quickly.

How to learn more about Machine Learning

In my mind, the biggest problem with machine learning right now is that it mostly lives in the world of academia and commercial research groups. There isn’t a lot of easy to understand material out there for people who would like to get a broad understanding without actually becoming experts. But it’s getting a little better every day.

If you want to try out what you’ve learned in this article, I made a course that walks you through every step of this article, including writing all the code. Give it a try!

If you want to go deeper, Andrew Ng’s free Machine Learning class on Coursera is pretty amazing as a next step. I highly recommend it. It should be accessible to anyone who has a Comp. Sci. degree and who remembers a very minimal amount of math.

Also, you can play around with tons of machine learning algorithms by downloading and installing SciKit-Learn. It’s a python framework that has “black box” versions of all the standard algorithms.


If you liked this article, please consider signing up for my Machine Learning is Fun! Newsletter:

Also, please check out the . It covers everything in this article in more detail, including writing the actual code in Python. You can get a free 30-day trial to watch the course if you sign up with this link.

You can also follow me on Twitter at @ageitgeyemail me directly or find me on linkedin. I’d love to hear from you if I can help you or your team with machine learning.

Now continue on to Machine Learning is Fun Part 2!

By Adam Geitgey

Full link: https://medium.com/@ageitgey/machine-learning-is-fun-80ea3ec3c471

Collection – The Link Between Psychedelics, God Encounters, and Mental Health

New research suggests having a mystical experience may have long-lasting benefits

On the subreddit r/LSD, a user recently posed a question to the 249,000-strong community of dedicated psychonauts: “Is God real?”

“It’s nearly 5 a.m. If you’re still up and reading this you’re probably tripping as well,” writes u/deftones_lover. “Anyway, is God real? What happens when we die?”

The post garnered a slew of responses from users who used the forum not so much to answer the questions, but to recount their own encounters with God — or some version of a higher power — while under the influence of psychedelics. Throwawayuser626, for instance, chimes in with, “Personally, I don’t believe in God still, but the experiences I’ve had on heavy doses of acid and shrooms are something beyond human comprehension. It does make me ask myself if this is the afterlife that I’m seeing.”

Inf4nticide, who identifies as “agnostic-leaning-toward-atheist,” says that during one trip, God revealed himself and forced the user to make an unexplained life-changing choice. “I realize that I was tripping,” Inf4nticide writes, “but certain aspects of it were simply too real to dismiss.”

Another user, Neosapian, describes meeting a “warm female presence” who dispensed some truths about human nature that shifted the user’s perspective long after the trip ended: “For months, I felt a calm glow of acceptance.”

It’s easy to dismiss these stories as nothing more than the philosophizing of high people. But as it turns out, encounters with the divine while using psychedelics could be more than just fleeting hallucinations; they might actually have something to do with the therapeutic benefits of tripping.

“One basic implication of this study is that this link between perceived oneness and life satisfaction occurs independent of your religious affiliation.”

Research into psychedelics has ramped up in recent years as scientists study the potential of long-illicit drugs such as LSD, psilocybin, and MDMA to treat everything from depression and anxiety to fear of death and addiction. In the course of this research, psychologists and neuroscientists have noticed a pattern when cataloging people’s experiences in these altered states: A large portion of people describe mystical encounters similar to those found on r/LSD. And like Reddit user Neosapian, many say they are also left with a lasting glow.

Researchers at the Johns Hopkins University School of Medicine wanted to know how these experiences might affect people in the long term. Were these encounters with spirituality just fleeting apparitions, or could they actually be life-altering? With this in mind, the researchers conducted an anonymous online survey with over 4,000 participants who said they had experienced their own brush with the divine whether under the influence of drugs or not, which the researchers described as “the God of your understanding,” a “higher power,” an “ultimate reality,” or an “aspect or emissary of God.”

The resulting study, published in April in the journal PLOS One, looked at both drug-induced and non-drug induced encounters — 3,476 people surveyed reported having a mystical experience while under the influence of LSD, psilocybin, ayahuasca, or DMT, and another 809 people reported such encounters unprompted by psychedelics, though the study did not specify what may have been the trigger in these cases. The researchers recruited the participants through internet ads, private email invitations, and social media.

In both groups, the researchers found that a majority of respondents cited lasting positive changes in their psychological health following their experience — such as life satisfaction and increased purpose and meaning — sometimes even decades later.

What’s more, over two-thirds of the people in the psychedelics group who said they were atheists before their trip-induced encounter with God no longer identified that way afterward. Specifically, 21% of psychedelics users called themselves non-believers before and just 8% identified as such after.

On the whole, over two-thirds of the people in the study reported that their encounters involved communication with some entity having the attributes of consciousness, benevolence, intelligence, sacredness, or eternal existence. In fact, about 70% said that, although this mystical entity existed in another dimension or reality, they believed it continued to exist after the encounter, which could help explain their newfound spiritual identities as well as the lasting psychological benefits.

“Although modern Western medicine doesn’t typically consider ‘spiritual’ or ‘religious’ experiences as one of the tools in the arsenal against sickness, our findings suggest that these encounters often lead to improvements in mental health,” the study’s lead researcher, Roland Griffiths, PhD, said in a press release.

This study isn’t the first to look at the relationship between psychedelics and spirituality. The first major study of psychedelics and spirituality took place on Good Friday in 1962 in the basement of Marsh Chapel at Boston University. There, Harvard researchers (who were under the supervision of the famous psychologist Timothy Leary) gave LSD to 10 divinity students in hopes that it would trigger a mystical experience. Nine of those students said it did, and that it had a lasting impact.

“I had believed in God… but until the Good Friday experiment, I had no personal encounter with God,” one of those students, the late historian Huston Smith, later wrote. “The experience was powerful for me, and it left a permanent mark on my experienced worldview.” Smith eventually penned the philosophical text Cleansing the Doors of Perception, which explores the potential of psychedelic drugs as entheogens, a.k.a. “God-revealing chemicals.”

After the Good Friday experiment, other researchers began studying this phenomenon, too, but by the 1970s, psychedelics were banned and this research ended altogether.

Griffiths, the lead author of this most recent study, has been paramount to reviving this area of study. In 2009, he conducted the first major study of drugs and spirituality since the 1970s and has launched several more since. In a 2018 study looking at the use of psilocybin to treat addiction, depression, and anxiety in terminally ill people, Griffiths and his team found that study participants who reported having a mystical experience while on the drug were more likely to reap long-lasting psychological benefits, including life satisfaction, social relationships, spiritual awareness in everyday life, attitudes about life, self, mood, and behavior.

For that study, researchers gave psilocybin to people who also agreed to take on a spiritual practice such as meditation. The men and women were divided into three groups and were given different combinations of a high or low dose of psilocybin along with “moderate” to “high” support for their spiritual practice. After six months, the people who were given higher doses of the drug showed the most positive changes, including “interpersonal closeness, gratitude, life meaning/purpose, forgiveness, death transcendence, daily spiritual experiences, religious faith and coping, and community observer ratings,” according to the study.

While the results suggest that psychedelics could have a greater impact on the spirituality-happiness connection, another April 2019 study recently found that, beyond the use of psychedelics, people who feel a sense of “oneness,” or a connection to “a divine principle, life, the world, other persons, or even activities,” report higher levels of satisfaction in their lives than those who don’t. According to the study, these findings are regardless of religious affiliation. In fact, some religious affiliations had an insignificant or even negative impact on oneness feelings.

“I always felt that there is this relationship between feeling that everything is one, and being more satisfied with the state of the world or accepting how life is and understanding also why it is this way,” says the study’s author, Laura Edinger-Schons, a professor of corporate social responsibility at the University of Mannheim. “And one basic implication of this study is that this link between perceived oneness and life satisfaction occurs independent of your religious affiliation. That means that you could also just learn something about philosophy or take part in yoga classes or do some meditation.”

While the reasons are still unknown, the researchers argue that having a spiritual experience appears to improve people’s mental health, and the connection should be further studied. For now, the psychedelic-curious can join u/deftones_lover for some late-night mystical musing.

By Tessa Love

Full link: https://elemental.medium.com/the-link-between-psychedelics-god-encounters-and-mental-health-87090d8a56b1

Collection – Stark partisan divisions in Americans’ views of ‘socialism,’ ‘capitalism’

Most Republicans strongly reject 'socialism'; Democrats are much more positive, but less vehementRepublicans express intensely negative views of “socialism” and highly positive views of “capitalism.”

By contrast, majorities of Democrats view both terms positively, though only modest shares have strong impressions of each term.

Overall, a much larger share of Americans have a positive impression of capitalism (65%) than socialism (42%), according to a new survey by Pew Research Center.

There are large partisan differences in views of capitalism: Nearly eight-in-ten Republicans and Republican-leaning independents (78%) express somewhat or very positive reactions to the term, while just over half of Democrats and Democratic leaners (55%) say they have a positive impression.

But these differences are dwarfed by the partisan gap in opinions about socialism. More than eight-in-ten Republicans (84%) have a negative impression of socialism; a 63% majority has a very negative view. Nearly two-thirds of Democrats (65%) have a positive view of socialism, but only 14% have a very positive view.

The survey, conducted April 29-May 13, 2019, also asked adults about their impressions of several other terms: “libertarian,” “progressive,” “liberal” and “conservative.” Republicans and Democrats diverge in their impressions of progressive, liberal and conservative, but express similar views of libertarian.

Many do not view socialism, capitalism in ‘either-or’ terms

While 39% of Americans have both a positive view of capitalism and a negative view of socialism, a quarter have positive views of both terms and 17% express negative opinions about both. Another 16% have a positive opinion of socialism and a negative opinion of capitalism.

Democrats far more likely than Republicans to hold positive views of both 'socialism' and 'capitalism'When parsing attitudes about both terms by partisanship, Democrats are more likely than Republicans to hold positive views of both socialism and capitalism (38%) than an exclusively positive view of one or the other. Smaller shares of Democrats have differing views of the two words or negative views of both.

Among Republicans, there is greater agreement. A majority (68%) say they have a positive view of capitalism and a negative view of socialism – including 39% who say they have a very positive view of capitalism and a very negative view of socialism.

Sizable racial and ethnic, age, gender and income differences in views of 'socialism' and 'capitalism'In addition to partisan differences on views of socialism and capitalism, there also are sizable demographic differences – including by age, gender and race and ethnicity.

Similar shares of adults younger than 30 express positive views of capitalism (52%) and socialism (50%). Among older age groups, views of capitalism are more positive than opinions of socialism.

Women are more likely than men to view socialism positively (46% vs. 38%), while a much larger share of men (74%) than women (56%) view capitalism positively. Nearly twice as many men as women have a very positive impression of capitalism (33% vs. 17%).

Nearly two-thirds of black Americans (65%) and 52% of Hispanics have positive impressions of the term socialism, compared with just 35% of whites. Majorities of blacks, whites and Hispanics view capitalism positively.

Adults with family incomes of $75,000 or more have more positive views of capitalism than do those with lower incomes. The pattern is reversed for views of socialism: Those with incomes of less than $30,000 express more positive views of socialism than those with higher incomes.

The gender and age differences evident in these attitudes also hold when controlling for partisanship. Women in both parties have less positive views of the term capitalism than their male counterparts. Among Republicans, there is a 19 percentage point gender gap on capitalism, with Republican women expressing less positive views of capitalism than Republican men (68% to 87%, respectively). Just half of Democratic women say they have a positive view of capitalism (50%), compared with 62% of Democratic men.

Half of Democratic women – and fewer than half of Democrats under 30 – express positive views of 'capitalism'There is a more modest gender gap among Republicans on views of socialism (10 points); similar majorities of Democratic men and women say they have a positive view of socialism.

Mirroring the age divide among the public overall, younger people in both partisan groups are less likely than older adults to express positive views of capitalism, though the gap is much larger among Democrats.

Democrats under 30 have significantly less positive impressions of capitalism than their older counterparts. In fact, they are the only subgroup for which views of the term are more negative than positive on balance (43% hold positive views, 55% hold negative views). In contrast, a majority of Democrats ages 65 and older have positive views of capitalism (69%), as do majorities of those 50 to 64 (58%) and 30 to 49 (55%).

Younger Republicans (18 to 49) are slightly less likely to hold positive views of capitalism than those 50 and older (75% to 80%, respectively), and are significantly less likely to hold very positive views.

Although only small shares of Republicans in any age group report having positive views of socialism, those 18 to 29 are significantly more likely than older Republicans to have a positive view (25% vs. 13%, respectively). Among Democrats, similar majorities within each age group report having positive impressions of the term.

Majorities have positive views of ‘progressive,’ ‘conservative,’ ‘liberal,’ ‘libertarian’

Americans have generally positive views of other political terms asked about in the survey, though these views also differ along partisan lines. Majorities have positive impressions of “progressive” (66%), “conservative” (60%), “liberal” (55%) and “libertarian” (also 55%).

Partisans diverge in impressions of 'progressive,' 'liberal,' 'conservative' – but not 'libertarian'Democrats are more than twice as likely as Republicans to have a positive view of the term progressive (88% vs. 40%). The gap is even wider in positive impressions of “liberal” (81% vs. 23%).

An overwhelming majority of Republicans (87%) say they have positive impressions of “conservative,” while six-in-ten Democrats hold negative views.

Overall, Democrats hold more positive views of the term “conservative” than Republicans do of “liberal.” Nearly four-in-ten Democrats (38%) say they view “conservative” positively compared with fewer than a quarter of Republicans who view “liberal” in the same light.

Meanwhile, Americans overall view the term “libertarian” positively. An almost identical small majority of Republicans (55%) and Democrats (56%) express positive impressions of “libertarian,” but relatively small shares of both parties say they have a very positive view (12% of Republicans, 7% of Democrats). Instead, pluralities from each party say they have a somewhat positive impression of this term – including 49% of Democrats and 43% of Republicans.

Note: See full topline results and methodology

By HANNAH HARTIG 

Full link: https://www.pewresearch.org/fact-tank/2019/06/25/stark-partisan-divisions-in-americans-views-of-socialism-capitalism/?utm_source=Pew+Research+Center&utm_campaign=0492b47f26-EMAIL_CAMPAIGN_2019_06_28_01_26&utm_medium=email&utm_term=0_3e953b9b70-0492b47f26-400737085

Collection – World’s population is projected to nearly stop growing by the end of the century

World population growth is projected to flatten in coming decadesFor the first time in modern history, the world’s population is expected to virtually stop growing by the end of this century, due in large part to falling global fertility rates, according to a Pew Research Center analysis of new data from the United Nations.

By 2100, the world’s population is projected to reach approximately 10.9 billion, with annual growth of less than 0.1% – a steep decline from the current rate. Between 1950 and today, the world’s population grew between 1% and 2% each year, with the number of people rising from 2.5 billion to more than 7.7 billion.

Here are 11 key takeaways from the UN’s “World Population Prospects 2019”:

1Global fertility is falling as the world is agingThe global fertility rate is expected to be 1.9 births per woman by 2100, down from 2.5 today.The rate is projected to fall below the replacement fertility rate (2.1 births per woman) by 2070. The replacement fertility rate is the number of births per woman needed to maintain a population’s size.

2The world’s median age is expected to increase to 42 in 2100, up from the current 31 – and from 24 in 1950. Between 2020 and 2100, the number of people ages 80 and older is expected to increase from 146 million to 881 million. Starting in 2073, there are projected to be more people ages 65 and older than under age 15 – the first time this will be the case. Contributing factors to the rise in the median age are the increase in life expectancy and falling fertility rates.

3Africa is the only world region projected to have strong population growth for the rest of this century. Between 2020 and 2100, Africa’s population is expected to increase from 1.3 billion to 4.3 billion. Projections show these gains will come mostly in sub-Saharan Africa, which is expected to more than triple in population by 2100. The regions that include the United States and Canada (Northern America) and Australia and New Zealand (Oceania) are projected to grow throughout the rest of the century, too, but at slower rates than Africa. (This analysis uses regional classifications from the UN and may differ from other Pew Research Center reports.)

Population growth in Africa is projected to remain strong throughout this century4Europe and Latin America are both expected to have declining populations by 2100. Europe’s population is projected to peak at 748 million in 2021. The Latin America and Caribbean region is expected to surpass Europe in population by 2037 before peaking at 768 million in 2058.

5The population of Asia is expected to increase from 4.6 billion in 2020 to 5.3 billion in 2055, then start to decline. China’s population is expected to peak in 2031, while the populations of Japan and South Korea are projected to decline after 2020. India’s population is expected to grow until 2059, when it will reach 1.7 billion. Meanwhile, Indonesia – the most populous country in Southeastern Asia – is projected to reach its peak population in 2067.

6In the Northern America region, migration from the rest of the world is expected to be the primary driver of continued population growth. The immigrant population in the United States is expected to see a net increase of 85 million over the next 80 years (2020 to 2100) according to the UN projections, roughly equal to the total of the next nine highest countries combined. In Canada, migration is likely to be a key driver of growth, as Canadian deaths are expected to outnumber births.

7By 2100, five of the world's 10 largest countries are projected to be in AfricaSix countries are projected to account for more than half of the world’s population growth through the end of this century, and five are in Africa. The global population is expected to grow by about 3.1 billion people between 2020 and 2100. More than half of this increase is projected to come from Nigeria, the Democratic Republic of the Congo, Tanzania, Ethiopia and Angola, along with one non-African country (Pakistan). Five African countries are projected to be in the world’s top 10 countries by population by 2100.

8India is projected to surpass China as the world’s most populous country by 2027. Meanwhile, Nigeria will surpass the U.S. as the third-largest country in the world in 2047, according to the projections.

9Between 2020 and 2100, 90 countries are expected to lose population. Two-thirds of all countries and territories in Europe (32 of 48) are expected to lose population by 2100. In Latin America and the Caribbean, half of the region’s 50 countries’ populations are expected to shrink. Between 1950 and 2020, by contrast, only six countries in the world lost population, due to much higher fertility rates and a relatively younger population in past decades.

10By 2100, half of babies born worldwide are expected to be born in AfricaAfrica is projected to overtake Asia in births by 2060. Half of babies born worldwide are expected to be born in Africa by 2100, up from three-in-ten today. Nigeria is expected to have 864 million births between 2020 and 2100, the most of any African country. The number of births in Nigeria is projected to exceed those in China by 2070.

Meanwhile, roughly a third of the world’s babies are projected to be born in Asia by the end of this century, down from about half today and from a peak of 65% in the 1965-70 period.

11Latin America and the Caribbean had one of the world's youngest populations in 1950; by 2100, it is expected to have the world's oldestThe Latin America and Caribbean region is expected to have the oldest population of any world region by 2100, a reversal from the 20th century. In 1950, the region’s median age was just 20 years. That figure is projected to more than double to 49 years by 2100.

This pattern is evident when looking at individual countries in the region. For example, in 2020, the median ages of Brazil (33), Argentina (32) and Mexico (29) are all expected to be lower than the median age in the U.S. (38). However, by 2100, all three of these Latin American nations are projected to be older than the U.S. The median age will be 51 in Brazil, 49 in Mexico and 47 in Argentina, compared with a median age of 45 in the U.S. Colombia is expected to undergo a particularly stark transition, with its median age more than tripling between 1965 and 2100 – from 16 to 52.

Japan is projected to have the highest median age of any country in the world in 2020, at 48 years old. Japan’s median age is expected to continue to rise until it peaks at 55 in 2065. It is expected to be lower in 2100 (54). By that time, the country with the highest median age is expected to be Albania, with a median age of 61.

Correction: This post has been updated to clarify that India is expected to become the world’s most populous country by 2027. By 2059, its population is projected to reach 1.7 billion.

Note: The UN projections for the future population are based on assumptions about likely future changes in key demographic indicators, including fertility, life expectancy and migration. There is uncertainty regarding specific estimates. This analysis uses the medium variant for future dates, which takes the midpoint of likely outcomes. For more information, see the full UN report, data tables and methodology.

By ANTHONY CILLUFFO AND NEIL G. RUIZ

Full link: https://www.pewresearch.org/fact-tank/2019/06/17/worlds-population-is-projected-to-nearly-stop-growing-by-the-end-of-the-century/?utm_source=Pew+Research+Center&utm_campaign=8c881f687d-EMAIL_CAMPAIGN_2019_06_21_03_07&utm_medium=email&utm_term=0_3e953b9b70-8c881f687d-400737085

Collection – 2019 Global Payments Trends Report – Vietnam Country Insights

Vietnam’s e-commerce market is yet to become a major threat to bricks-and-mortar sales. But with a young population rapidly embracing mobile commerce, and a double-digit sales growth prediction to 2021, it is a market that should not be ignored by merchants on the hunt for up-and-coming e-commerce markets.

Introduction

Vietnam’s economy is expected to see some deceleration in gross domestic product growth, with expansion of 6.3 percent year-on-year projected for 2019, compared with the stellar 7.1 percent year-on-year outturn seen in 2018.1 On the back of this strong economic performance, Vietnam has a high predicted growth rate for e-commerce, with the sector forecast to increase 19 percent per year to 2021.2 The macroeconomic backdrop through early 2019 has been stable, and Consumer Price Index inflation should remain close to two percent year-on-year, a soft outcome in a historical context.3 This reflects lower global energy prices, which if sustained should dampen any rise in Vietnam’s inflation rate. Liquidity conditions also appear supportive to macroeconomic stability, following a turn in global risk sentiment, which should support capital inflow.4

This document is based on projected figures and is subject to change at any time.

Confident growth prediction in a youthful nation

Vietnam’s business to consumer e-commerce market is worth $6.2 billion,15 and it has been expanding rapidly, growing by 36.6 percent in 2017 alone.16 However, it is still dwarfed by bricks-and-mortar retail in Vietnam, with e-commerce accounting for just five percent of total retail.17 This represents a significant opportunity for online merchants to take market share and capitalize on an e-commerce market that is still in its relative infancy.

As a result, Vietnam has one of the highest predicted growth rates of the countries surveyed in our report series,* at a 19 percent compound annual growth rate to 2021.18 Numerous factors play into this confident growth prediction. Vietnam’s 95.6 million-strong population is heavily skewed towards younger age groups,19 with an average age of 30.9 years.20 Nearly a quarter of the population (23.3 percent) is aged 14 and under, which represents millions of potential new online shoppers over the coming decade.21

Internet penetration, at 49.7 percent,22 means almost half the population is at present without access. However, 37.1 percent of the population has shopped online,23suggesting strong uptake of e-commerce by those who do have internet access. In early 2019, the World Bank urged the Vietnamese government to invest further in its rollout of internet access and the digital economy.24

Electronics sales dominate online, and cross-border spending is already prevalent

Consumer electronics are the most-purchased e-commerce category, accounting for 33.6 percent of sales. Travel is the second most popular category, taking a 21.6 percent share of sales.25 Chinese-owned sales platform Lazada is a highly-frequented e-commerce site, as is Shopee and consumer to consumer sales platform, Sendo.26

A third (33 percent) of Vietnamese e-shoppers has shopped cross-border,27 and international e-commerce makes up 36 percent of total e-commerce spend in the country.28 China, South Korea and Japan are the top three most popular markets.29 At least 90 percent of investment into the Vietnamese e-commerce industry is from international sources, particularly south east Asian e-commerce merchants such as Lazada and its parent company Alibaba.30 Western e-commerce players are also beginning to notice the sales opportunity Vietnam represents. In 2018 Amazon announced a partnership with the Vietnam E-commerce Association in a move interpreted as signaling its intent to expand its presence in the country.31

Digital and physical infrastructure challenges could hinder growth

Barriers to e-commerce growth include relatively underdeveloped infrastructure to support both the digital processes involved with e-commerce and also physical transport and delivery infrastructure to complete orders. Vietnam has rural and mountainous regions currently underserved by e-commerce providers,32 leading to high logistic costs for online merchants who do sell in these regions. Logistics costs are estimated to take 30 percent of revenues in Vietnam for e-commerce companies. In comparison, logistics cost an average five to 15 percent of revenues for e-commerce merchants operating in India, and 11 percent for U.S.-based logistics for Amazon.33

However, logistics capabilities are improving. The country jumped 25 places in the World Bank’s logistics performance index in 2018, from 64th out of 160 countries in 2016 to 39th in 2018.34

Driving up basket spend and encouraging users to buy full-price items may represent another challenge. Annual total online spend per person is currently $175.15,35a figure that is among the lowest of the countries included in our report series.* Vietnamese shoppers are price-conscious, with 74 percent always checking the product price on other sites before committing to buy.36 Offering a review function on merchant sites could help drive confidence and willingness to buy, as 60 percent of shoppers will check reviews before completing an order.37

Mobile-first consumers fast to embrace smartphone shopping

Vietnam is a mobile-first nation of internet users, with internet access via smartphone often representing consumers’ first experience of the internet.38 Smartphone penetration, at 48.6 percent, means more than half the population is yet to buy a device.39 With gross domestic product growth strong, and a rising generation of younger, tech-savvy citizens, it seems likely this rate will increase quickly in the coming years.40

Vietnamese mobile commerce is projected to outpace overall e-commerce growth, expanding at a compound annual growth rate of 24.2 percent to 2021,41 by which point it is expected to represent a $7.8 billion market.42 Mobile devices are already the dominant way to access e-commerce in Vietnam, with 53 percent of sales completed on such devices.43 App use is also high, with 49.5 percent of transactions taking place via this channel.44

Refined, fast mobile checkout process cited as key to converting browsing to sales

For merchants, providing apps that make the mobile commerce payment process as smooth as possible is key to winning Vietnamese customers. Ease of checkout is cited as the most important factor in what makes a good online shopping experience, followed by the ability to compare product prices and assurances of safe payment systems.45

Shopping via social media is a key trend in Vietnam, with 66 percent of online shoppers having used Facebook to purchase items.46 Fashion is the most popular product category to buy via social media, followed by cosmetics.47 Social commerce is perceived to be particularly easy to navigate and order from.48

Cards rank highest for online payments, but cash persists

Cards are the dominant payment method in Vietnamese e-commerce, used for 34 percent of transactions.49 Card usage is predicted to increase at a compound annual growth rate of 15 percent to 2021, by which point it will retain its position as the most-utilized payment method.50 Debit-based payments are far more likely than credit card payments: debit card ownership stands at 1.29 per capita compared with 0.08 per capita for credit cards.51

Digital wallets are set to be the fastest-growing e-commerce payment method between now and 2021, expanding 28 percent per year to become the second most-used method after cards by that point.52 The rapid uptake of smartphones offering app-based payment methods is also set to drive digital wallet adoption. The State Bank of Vietnam reports that the number of mobile phone-based transactions over the first nine months of 2017 was 90 million, up 93 percent on the same period in 2016, with that number expected to continue to rise rapidly in 2019 and beyond.53

At present, popular digital wallet brands include PayPal®,54 and domestic brands Momo and ZaloPay. Momo boasts just under 10 million users and was the country’s most-downloaded digital wallet app in 2018.55 ZaloPay is the payment application of popular Vietnamese social media app Zalo.

Digital wallets driving innovative updates of local payment traditions

Payment apps are being used to facilitate a digital evolution of Vietnam’s red-envelope culture, whereby monetary gifts are given in small red envelopes to family, friends and colleagues. Momo introduced a digital red envelope function on its digital wallet app in 2018. It became a viral success and three million digital red envelopes were exchanged in its inaugural event.56 In 2019, Momo created a Black Friday style ‘Lucky New Year’ event for e-commerce merchants, whereby companies accepting Momo can offer discounts to consumers who wish to exchange gifts between family and friends.57

Cash on delivery is still a significant part of the Vietnamese online shopping market. Cash therefore accounts for 19 percent of e-commerce transactions, but this is projected to decline to just five percent by 2021.58 The Vietnamese government is attempting to move citizens away from cash use. As of 2013, car and house purchases must be paid via non-cash methods in an attempt to wean shoppers off cash payments.59

Tighter regulation could boost consumer confidence

As with any other e-commerce market, payment fraud is a concern in Vietnam. The government has warned that incidences of payment fraud, counterfeit goods and intellectual property rights infringements have increased in line with rising online sales.60 Future introductions of tighter e-commerce regulations and an increase in uptake of digital payment methods could help curb fraud in the future.

Key takeaways

While a variety of payment methods are used, cards represent the most popular way for Vietnamese consumers to pay for the products they buy online. The Vietnamese also demonstrate a willingness to shop abroad with foreign purchases accounting for over a third of total e-commerce spend in Vietnam. As an attractive emerging economy, the majority of investment into the Vietnamese e-commerce industry is from international sources, particularly south east Asian e-commerce merchants such as Lazada and its parent company Alibaba. Western e-commerce players are also beginning to take notice. In 2018, Amazon announced a partnership with the Vietnam E-commerce Association in a move interpreted as signaling its intent to expand its presence in the country. However, international merchants should be aware of the country’s infrastructural issues – logistics remains the main burden for the sector, especially for customers in rural areas or second-tier cities.

Data may vary from historical figures, due to certain categories being re-stated as new information sources have become available.

*J.P. Morgan 2019 Payments Trends – Global Insights Report series includes the following countries: Australia, Brazil, Canada, China, Hong Kong, India, Indonesia, Japan, Malaysia, Mexico, New Zealand, Singapore, Thailand, Turkey, U.S., Vietnam.

For more information, please contact:

Your J.P. Morgan Relationship Manager or visit: https://www.jpmorgan.com/country/US/en/merchant-services/payment-insights

This presentation was prepared exclusively for the benefit and internal use of the J.P. Morgan client or potential J.P. Morgan client to whom it is directly delivered and/or addressed (including subsidiaries and affiliates, the “Company”) in order to assist the Company in evaluating, on a preliminary basis, the feasibility of a possible transaction or transactions or other business relationship and does not carry any right of publication or disclosure, in whole or in part, to any other party.  This presentation is for discussion purposes only and is incomplete without reference to, and should be viewed solely in conjunction with, the oral briefing provided by J.P. Morgan.  Neither this presentation nor any of its contents may be disclosed or used for any other purpose without the prior written consent of J.P. Morgan. This presentation does not constitute a commitment by any J.P. Morgan entity to extend or arrange credit or to provide any other services to Company.

In preparing this presentation, we have relied upon and assumed, without independent verification, the accuracy and completeness of all information available from public sources or which was provided to us by or on behalf of the Company or which was otherwise reviewed by us.  The statements, views, and opinions that will be expressed during the presentation are those of the presenters and are not endorsed by, or reflect the views or positions of, J.P. Morgan.  The information herein may not take into account individual client circumstances, objectives or needs and is not necessarily intended as a recommendation of a particular product or strategy to the Company and Company shall make its own independent decision. J.P. Morgan is not liable for decisions made or actions taken in reliance on any of the information covered during the presentation. Furthermore, J.P. Morgan makes no representations as to the actual value which may be received in connection with a transaction or use of the products and services mentioned nor the legal, tax or accounting effects of consummating a transaction.

J.P. Morgan, Chase Paymentech, Chase Merchant Services, JPMorgan and JPMorgan Chase are marketing names for certain businesses of JPMorgan Chase & Co. and its subsidiaries worldwide (collectively, “J.P. Morgan”) and if and as used herein may include as applicable employees or officers of any or all of such entities irrespective of the marketing name used.  Products and services may be provided by commercial bank affiliates, securities affiliates or other J.P. Morgan affiliates or entities.  In particular, securities brokerage services other than those which can be provided by commercial bank affiliates under applicable law will be provided by registered broker/dealer affiliates such as J.P. Morgan Securities LLC, J.P. Morgan Institutional Investments Inc. or by such other affiliates as may be appropriate to provide such services under applicable law.  Such securities are not deposits or other obligations of any such commercial bank, are not guaranteed by any such commercial bank and are not insured by the Federal Deposit Insurance Corporation.  Not all products and services are available in all geographic areas. Eligibility for particular products and services is subject to final determination by J.P. Morgan or its affiliates/subsidiaries.

IRS Circular 230 Disclosure:  J.P. Morgan does not provide tax advice.  Accordingly, any discussion of U.S. tax matters included herein (including any attachments) is not intended or written to be used, and cannot be used, in connection with the promotion, marketing or recommendation by anyone not affiliated with J.P. Morgan of any of the matters addressed herein or for the purpose of avoiding U.S. tax-related penalties.

© 2019 JPMorgan Chase & Co


1 Economic Research, J.P. Morgan Chase Bank, March 2019.

2 J.P. Morgan 2019 Payments Trends – Global Insights Report: Data has been provided to J.P. Morgan Merchant Services by Edgar, Dunn and Company via Vietnam.net: Vietnam’s e-commerce growth forecast to double by 2020, October 2017.

3 Economic Research, J.P. Morgan Chase Bank, March 2019.

4 Economic Research, J.P. Morgan Chase Bank, March 2019.

5 J.P. Morgan 2019 Payments Trends – Global Insights Report: Data has been provided to J.P. Morgan Merchant Services by Edgar, Dunn and Company via World Bank, 2017.

6 J.P. Morgan 2019 Payments Trends – Global Insights Report: Data has been provided to J.P. Morgan Merchant Services by Edgar, Dunn and Company via CIA World Factbook, 2017.

7 World Bank Open Data. ‘Vietnam.’ Accessed April 2019.

8 J.P. Morgan 2019 Payments Trends – Global Insights Report: Data has been provided to J.P. Morgan Merchant Services by Edgar, Dunn and Company via EU-Vietnam Business Network: E-Commerce industry in Vietnam Research Report and EDC Analysis, 2017.

9 J.P. Morgan 2019 Payments Trends – Global Insights Report: Data has been provided to J.P. Morgan Merchant Services by Edgar, Dunn and Company via EDC Analysis, 2017.

10 J.P. Morgan 2019 Payments Trends – Global Insights Report: Data has been provided to J.P. Morgan Merchant Services by Edgar, Dunn and Company via EU-Vietnam Business Network: E-Commerce industry in Vietnam Research Report and EDC Analysis, 2017.

11 J.P. Morgan 2019 Payments Trends – Global Insights Report: Data has been provided to J.P. Morgan Merchant Services by Edgar, Dunn and Company via World Bank, 2017.

12 J.P. Morgan 2019 Payments Trends – Global Insights Report: Data has been provided to J.P. Morgan Merchant Services by Edgar, Dunn and Company via McKinsey, ‘The Digital Archipelago’, 2018.

13 J.P. Morgan 2019 Payments Trends – Global Insights Report: Data has been provided to J.P. Morgan Merchant Services by Edgar, Dunn and Company via World Bank, 2017.

14 J.P. Morgan 2019 Payments Trends – Global Insights Report: Data has been provided to J.P. Morgan Merchant Services by Edgar, Dunn and Company via The State Bank of Vietnam and EDC Analysis, 2017.

15 J.P. Morgan 2019 Payments Trends – Global Insights Report: Data has been provided to J.P. Morgan Merchant Services by Edgar, Dunn and Company via EU-Vietnam Business Network: E-Commerce industry in Vietnam Research Report and EDC Analysis, 2017.

16 J.P. Morgan 2019 Payments Trends – Global Insights Report: Data has been provided to J.P. Morgan Merchant Services by Edgar, Dunn and Company via EU-Vietnam Business Network: E-Commerce industry in Vietnam Research Report and EDC Analysis, 2017.

17 J.P. Morgan 2019 Payments Trends – Global Insights Report: Data has been provided to J.P. Morgan Merchant Services by Edgar, Dunn and Company via EU-Vietnam Business Network: E-Commerce industry in Vietnam Research Report and EDC Analysis, 2017.

18 J.P. Morgan 2019 Payments Trends – Global Insights Report: Data has been provided to J.P. Morgan Merchant Services by Edgar, Dunn and Company via Vietnam.net: Vietnam’s e-commerce growth forecast to double by 2020, October 2017.

19 J.P. Morgan 2019 Payments Trends – Global Insights Report: Data has been provided to J.P. Morgan Merchant Services by Edgar, Dunn and Company via World Bank, 2017.

20 J.P. Morgan 2019 Payments Trends – Global Insights Report: Data has been provided to J.P. Morgan Merchant Services by Edgar, Dunn and Company via CIA World Fact Book, 2017.

21 J.P. Morgan 2019 Payments Trends – Global Insights Report: Data has been provided to J.P. Morgan Merchant Services by Edgar, Dunn and Company via CIA World Fact Book, 2017.

22 J.P. Morgan 2019 Payments Trends – Global Insights Report: Data has been provided to J.P. Morgan Merchant Services by Edgar, Dunn and Company via World Bank, 2017.

23 J.P. Morgan 2019 Payments Trends – Global Insights Report: Data has been provided to J.P. Morgan Merchant Services by Edgar, Dunn and Company via eShopworld & EDC Analysis, 2017.

24 Vietnamnews.vn, March 2019. ‘Digital economy needs supporting policies: experts.’ Accessed April 2019.

25 J.P. Morgan 2019 Payments Trends – Global Insights Report: Data has been provided to J.P. Morgan Merchant Services by Edgar, Dunn and Company via E-commerce Foundation, 2017.

26 SlideShare.net, February 2018. ‘Vietnam E-Commerce Report 2017.’ Accessed April 2019.

27 J.P. Morgan 2019 Payments Trends – Global Insights Report: Data has been provided to J.P. Morgan Merchant Services by Edgar, Dunn and Company via ecommerceIQ and EDC analysis, 2017.

28 J.P. Morgan 2019 Payments Trends – Global Insights Report: Data has been provided to J.P. Morgan Merchant Services by Edgar, Dunn and Company via ecommerceIQ and EDC analysis, 2017.

29 J.P. Morgan 2019 Payments Trends – Global Insights Report: Data has been provided to J.P. Morgan Merchant Services by Edgar, Dunn and Company via eShopworld, 2017.

30 Asia.Nikkei.com, March 2018. ‘Amazon to enter Vietnam in challenge to Alibaba.’ Accessed April 2019.

31 Asia.Nikkei.com, March 2018. ‘Amazon to enter Vietnam in challenge to Alibaba.’ Accessed April 2019.

32 RetailNews.Asia, March 2019. ‘Vietnam’s e-commerce revenue forecast to hit $15 bn in 2020.’ Accessed April 2019.

33 Vietnam-Briefing.com, August 2018. ‘Vietnam Climbs 25 Places in World Bank’s Logistics Index.’ Accessed April 2019.

34 Vietnam-Briefing.com, August 2018. ‘Vietnam Climbs 25 Places in World Bank’s Logistics Index.’ Accessed April 2019.

35 J.P. Morgan 2019 Payments Trends – Global Insights Report: Data has been provided to J.P. Morgan Merchant Services by Edgar, Dunn and Company via EDC Analysis, 2017.

36 SlideShare.net, February 2018. ‘Vietnam E-Commerce Report 2017.’ Accessed April 2019.

37 SlideShare.net, February 2018. ‘Vietnam E-Commerce Report 2017.’ Accessed April 2019.

38 J.P. Morgan 2019 Payments Trends – Global Insights Report: Data has been provided to J.P. Morgan Merchant Services by Edgar, Dunn and Company via FinTech news: Mobile Drives Internet Penetration and Habits in Vietnam, Says New Study, May 2016.

39 J.P. Morgan 2019 Payments Trends – Global Insights Report: Data has been provided to J.P. Morgan Merchant Services by Edgar, Dunn and Company via McKinsey, ‘The Digital Archipelago’, 2018.

40 SBR.com, April 2019. ‘Vietnam GDP rose 6.8% in Q1.’ Accessed April 2019.

41 J.P. Morgan 2019 Payments Trends – Global Insights Report: Data has been provided to J.P. Morgan Merchant Services by Edgar, Dunn and Company via EDC Analysis, 2017.

42 J.P. Morgan 2019 Payments Trends – Global Insights Report: Data has been provided to J.P. Morgan Merchant Services by Edgar, Dunn and Company via EDC Analysis, 2017.

43 J.P. Morgan 2019 Payments Trends – Global Insights Report: Data has been provided to J.P. Morgan Merchant Services by Edgar, Dunn and Company via EU-Vietnam Business Network: E-Commerce industry in Vietnam Research Report and EDC Analysis, 2017.

44 J.P. Morgan 2019 Payments Trends – Global Insights Report: Data has been provided to J.P. Morgan Merchant Services by Edgar, Dunn and Company via EU-Vietnam Business Network: E-Commerce industry in Vietnam Research Report and EDC Analysis, 2017.

45 Visa.com.sg, 2018. ‘Visa Consumer Payment Attitudes Survey.’ Accessed April 2019.

46 SlideShare.net, February 2018. ‘Vietnam E-Commerce Report 2017.’ Accessed April 2019.

47 SlideShare.net, February 2018. ‘Vietnam E-Commerce Report 2017.’ Accessed April 2019.

48 SlideShare.net, February 2018. ‘Vietnam E-Commerce Report 2017.’ Accessed April 2019.

49 J.P. Morgan 2019 Payments Trends – Global Insights Report: Data has been provided to J.P. Morgan Merchant Services by Edgar, Dunn and Company, 2019.

50 J.P. Morgan 2019 Payments Trends – Global Insights Report: Data has been provided to J.P. Morgan Merchant Services by Edgar, Dunn and Company, 2019.

51 J.P. Morgan 2019 Payments Trends – Global Insights Report: Data has been provided to J.P. Morgan Merchant Services by Edgar, Dunn and Company via The State Bank of Vietnam and EDC Analysis, 2017.

52 J.P. Morgan 2019 Payments Trends – Global Insights Report: Data has been provided to J.P. Morgan Merchant Services by Edgar, Dunn and Company, 2019.

53 Fintechnews.sg, August 2018. ‘Vietnam: Rise of E-Commerce Paving the Way for Digital, Mobile Payments Boom.’Accessed April 2019.

54 J.P. Morgan 2019 Payments Trends – Global Insights Report: Data has been provided to J.P. Morgan Merchant Services by Edgar, Dunn and Company, 2019.

55 VietnamInsider.vn, January 2019. ‘MoMo announces record-breaking growth in 2018.’ Accessed April 2019.

56 VietnamInsider.vn, January 2019. ‘MoMo announces record-breaking growth in 2018.’ Accessed April 2019.

57 VietnamInsider.vn, January 2019. ‘MoMo announces record-breaking growth in 2018.’ Accessed April 2019.

58 J.P. Morgan 2019 Payments Trends – Global Insights Report: Data has been provided to J.P. Morgan Merchant Services by Edgar, Dunn and Company, 2019.

59 J.P. Morgan Global Payments Report: Data has been provided to J.P. Morgan Merchant Services by Edgar, Dunn and Company via Vietnam.net.

60 VietnamPlus.vn, March 2019. ‘E-commerce market a haven for fake goods.’ Accessed April 2019.

Full link: https://www.jpmorgan.com/merchant-services/insights/reports/vietnam

Collection – Economic Conditions Snapshot, June 2019: McKinsey Global Survey results

Executives’ sentiments on the global economy are the lowest in years, amid growing concerns over trade conflicts. Meanwhile, their expectations about conditions at home remain more negative than positive.

Executives’ views of the global economy are more downbeat than they have been in years, and few expect improvements in the months ahead, according to McKinsey’s latest survey on economic conditions.1 In fact, in every region, respondents are more likely to say conditions in the global economy and their home countries have declined in recent months. What’s more, for the first time since we began asking about expectations for the global economy in 2011, a majority of respondents say they expect the economy to worsen in the next six months. Concerns about trade have grown since the previous survey, and a rising share of respondents predict that the level of trade between their home countries and the world will decline over the next year. Among regions, there are some bright spots: respondents in Latin America and India offer more positive expectations than their peers elsewhere on trade levels and their economies’ prospects. Meanwhile, those in developed Asia are particularly glum across a range of macroeconomic and company-level issues.2

Cautious views of the global economy

We strive to provide individuals with disabilities equal access to our website. If you would like information about this content we will be happy to work with you. Please email us at: McKinsey_Website_Accessibility@mckinsey.com

The share of respondents reporting recent declines in global economic conditions has not been this large in several years, and their expectations for the next six months are no more positive. Nearly six in ten respondents in June say current conditions in the global economy are worse now than six months ago—the largest share to say so since September 2015. Compared with one year ago, the share of respondents reporting declines in the global economy has more than doubled (Exhibit 1).

When asked about the next six months, respondents are similarly wary: 57 percent say they expect global economic conditions to decline in the next six months—a larger share than has said so in any survey since we began asking about future conditions in the global economy in March 2011. In contrast with the previous survey, respondents in every region are now more likely to expect the world economy to decline than to improve.

Concerning the expected rate of global growth, the share of pessimistic responses is larger than we have seen previously. For the first time since we began asking about changes in the global economy’s growth rate, a majority of respondents predict that the growth rate will slow in the next six months. Whereas in March 2019, 44 percent of respondents said they expected the growth rate to slow, now 55 percent say so.

When respondents identify risks to global economic growth in the year ahead, they most often cite trade conflicts, as they did in the March survey. Further, the share citing trade conflicts as a risk has increased since March (Exhibit 2). As in the previous survey, geopolitical instability is the second most commonly cited risk to growth, followed by changes in trade policy. Like trade conflicts, changes in trade policy are cited by a larger share now than three months ago.

We strive to provide individuals with disabilities equal access to our website. If you would like information about this content we will be happy to work with you. Please email us at: McKinsey_Website_Accessibility@mckinsey.com

For home economies, modest expectations amid concerns about trade

While respondents appear less downbeat about their home economies than about global conditions, their assessments are more negative than positive: 22 percent of respondents say conditions are better now than six months ago, while 43 percent say their economies have declined—in line with the results from three and six months ago. In contrast to the earlier surveys, larger shares of respondents in every region now say conditions have declined than say their economies have improved.

In the next six months, respondents continue to be more likely to predict their home economies will worsen than to predict improvement, as they have been since September 2018. The only regions where respondents are more likely to expect improvements than worsening conditions are India and Latin America.

Since the previous survey, concerns over trade-policy changes as risks to near-term domestic growth have grown. Policy changes are now cited most often, with 47 percent of respondents saying changes in trade policy are risks to their countries’ growth in the next year—up from about one-third who said so in March 2019 (Exhibit 3).

We strive to provide individuals with disabilities equal access to our website. If you would like information about this content we will be happy to work with you. Please email us at: McKinsey_Website_Accessibility@mckinsey.com

As in the past two surveys, larger shares of respondents say trade levels between their countries and the rest of the world declined than increased over the past year. What’s more, respondents who report changing trade levels are three times more likely to say those changes had a negative effect on their business than to report a positive impact. This is a decline from March, when respondents were twice as likely to report negative effects than positive ones.

Looking ahead, expectations for future trade levels also have declined since the previous survey. Nearly half of respondents predict the level of trade between their countries and the rest of the world will decline over the next year (Exhibit 4). This is the largest share to say so since 2016, when we first asked this question. By region, majorities of the respondents in Latin America and in India say trade will increase in the year ahead. But in all other regions, respondents are much more likely to expect a decline than an increase.

We strive to provide individuals with disabilities equal access to our website. If you would like information about this content we will be happy to work with you. Please email us at: McKinsey_Website_Accessibility@mckinsey.com

Developed Asia’s pronounced pessimism

Respondents in developed Asia offer notably gloomier views, compared with the previous survey and with their peers elsewhere, about the world economy, conditions at home, and their companies. Not only are they more likely now than three months ago to say the world economy has worsened (Exhibit 5), they are more likely to say so than respondents in any other region. Similarly, these respondents are more than three and a half times likelier to say they expect the growth rate of the global economy to slow down than to say they expect it to increase—and more likely to say so than respondents in any other region.

We strive to provide individuals with disabilities equal access to our website. If you would like information about this content we will be happy to work with you. Please email us at: McKinsey_Website_Accessibility@mckinsey.com

Developed Asia also is the region where the largest share of respondents—59 percent—say conditions in their home economies have declined over the past six months. Whereas in March, respondents in the region were about twice as likely to report a decline than an improvement, they are now more than five times as likely to say so.

In regard to trade levels, respondents in developed Asia are more likely now than in March to report declining trade between their countries and the rest of the world: 60 percent now say so, compared with 46 percent in the previous survey. This is the second survey in a row in which respondents in the region are more likely than their peers elsewhere to say changes in the level of trade have had a negative effect on their business.

Respondents in developed Asia also report lower expectations for their companies. They are less likely than those in other regions—and less likely than the region’s respondents in March—to predict their companies’ profits will increase in the next six months (Exhibit 6). And in a change from March, respondents in the region also report the most negative workforce-size expectations of any region: more than one-third now predict that their workforces will decrease in the coming months, compared with a global average of 23 percent.

By Alan FitzGerald, Vivien Singer, Sven Smit

Full link: https://www.mckinsey.com/business-functions/strategy-and-corporate-finance/our-insights/economic-conditions-snapshot-june-2019-mckinsey-global-survey-results?cid=other-eml-alt-mip-mck&hlkid=08e1593128ad4bc99695fb3931dceb64&hctky=2618809&hdpid=144c5071-0db0-435f-a374-0f7604ac1445

Note – DealStreetAsia: The Week That Was

We continued to stay on top of developments at L Catterton Asia where a team of executives led by its chairman and managing partner Ravi Thakran is launching a new spin-out fund with a target to raise $500-750 million.

This week, Tanu reported that the fund is set to secure the backing of a Southeast Asian conglomerate and a Middle East-based fund. In another exclusive, she wrote that LPs backing the PE firm’s latest fund are set to decide on the vehicle’s fate as the executives’ departure has triggered a so-called ‘key man’ clause.

Exit events 

Myanmar’s telecom tower operator Irrawaddy Green Towers is on the block as its PE investors are seeking an exit, Deviana reported this week.

Indonesia’s Reliance Capital Management is looking to hire an additional underwriter for a planned $300-million IPO. The listing, scheduled for the fourth quarter of this calendar year, will comprise a mix of new and existing shares.

Quynh reported Sieu Viet Group‘s acquisition of Vietnamese HR platform MyWork in an exclusive story. The acquisition will help the former strengthen its services for the small business customer segment.

Funds mop up more capital

Warburg Pincus announced the final close of its China-Southeast Asia fund at over $4.25 billion. This is the PE firm’s first fund to have a dedicated Southeast Asia focus.

Indonesian VC Skystar Capital is likely to hold a first close soon for its third fund, which has a target corpus of $50 million, Aastha reported.

Singapore’s Tin Men Capital has raised $20.8 million from 50 investors for its first fund, per an SEC filing. The VC firm focuses on B2B tech startups.

Startups on the fundraising trail

Indonesian grab-and-go coffee chain Kopi Kenangan announced a $20-million growth funding round from Sequoia India, confirming an earlier report from DealStreetAsia.

Singapore-based event tech startup PouchNATION closed a $3-million Series B investment from Indonesian online travel unicorn Traveloka and SPH Ventures.

Grab backed an $8-million Series A round for London-based Splyt Technologies, which aims to make international ride-hailing roaming a reality.

Deep dive

Southeast Asia’s unicorns have been behind nearly 40 acquisitions over the last few years. In an in-depth story, Ardi noted how these mega startups’ increased buyout appetite could spur more exits in the region. There is also a handy list of all the acquisitions announced and in the offing.

Hock wrote an analytical piece on NYSE-listed Sea Ltd’s turnaround in the public markets to become Southeast Asia’s most valuable internet firm with a market cap exceeding $15 billion.

Up close and personal

Institutional real estate in Asia is maturing, AEW Capital Management‘s Asia Pacific chief David Schaefer told Ka Kay Lum in an interview. He noted how the institutional stock of real estate in Asia is increasing at a much faster rate than North America and Europe combined.

India’s homegrown travel giant MakeMyTrip’s Deep Kalra spoke to me about plans to expand his growing empire. The company, which is backed by China’s Ctrip, is eyeing acquisitions in India or where Indians are travelling most, he said.

Have a great week ahead.

– Paramita – Editor, DealStreetAsia

Note – McKinsey: New research on talent: Are you taking a blinkered view?

This week: How realistic are leaders about their talent strategies? Plus, the CEO of Informatica on how data drives value, and reading picks from Tera Allas, a director of research and economics in London, who also happens to be a Commander of the Order of the British Empire. And speaking of Britain, the Shortlist is taking the July 4 US holiday off. We’ll see you back here on July 12.
illustration of fish
Your organization recruits, trains, and promotes the best people. Your HR department is hard at work and the C-suite is engaged, confident that you have the right talent to maximize your company’s value. But could you be too confident—in the same, uneasy way that three of four drivers believe they’re above average?
McKinsey recently conducted a survey of 500 managers in the United Kingdom as part of a research project with the Confederation of British Industry. The findings suggest that CEOs and HR leaders may take a more rose-colored view of their talent practices than others in their organization.
Among CEOs and HR leaders, 64 percent said their companies were high adopters of 21 generally accepted talent practices—recruitment, employee engagement, team efficiency, and so on. Yet just 42 percent of other respondents from these same companies agreed with them. CEOs were twice as likely to say their companies excelled at knowing “who the best people are and put[ting] them to work on the most important business priorities.”
The problem is that even when best practices are well understood in the executive suite, the rest of the company might receive a far different message. Like, we don’t have time. Our management doesn’t value the practice. People who deliver continuous improvement aren’t rewarded.
One nugget that stood out: 37 percent of respondents said they have more important things to worry about than changing recruitment processes to improve workplace diversity—despite a growing body of evidence linking gender, ethnic, and cultural diversity to positive business outcomes.
And workers are paying attention. A 2018 survey found that poor management was the top reason UK employees weren’t happy in their current roles, and comparable US studies also suggest dissatisfaction with leadership is commonplace.
The good news: fixing the imbalance may not take a massive overhaul, if the people with the right skills are matched with strategic positions. At even the biggest companies, a tiny fraction of positions—50 or fewer roles in all—deliver the majority of value. Many of these people won’t all be at the top of the organization, with some key roles found several layers beneath the C-suite.
Companies that embark on a process of soul searching may find themselves long on talent—or short. Here are some good ideas on how to build talent, rent it, or redeploy it.
The patient will see you now
Technology-driven innovation holds the potential to improve our understanding of patients, enable the delivery of more convenient, individualized care—and create $350 billion to $410 billion in annual value by 2025. That’s because the great bulk of the data generated by patients are related to societal and environmental influences, which determine 60 percent of overall health outcomes. In fact, there’s 2,750 times more data on those factors than on clinical care, which contributes only 15 percent to outcomes.
Power partnerships, retail-style exhibit
the Shortlist

McKinsey & Company

Note – Fisher: More Reasons to Doubt the Alleged Trade War’s Bite

News Wednesday showed companies are very adept at getting around trade barriers—barriers that may not last long anyway.

Editors’ Note: MarketMinder doesn’t recommend individual securities. The below merely represent a broader theme we wish to highlight.

With the G20 meeting in Japan approaching, it seems most pundits are transfixed, arguing the meeting is make-or-break for global stocks—particularly its sidebar between US President Donald Trump and Chinese President Xi Jinping on trade tensions. Mere weeks ago, Trump’s ban on firms selling US products to Chinese Tech giant Huawei roiled sentiment. Ditto for his renewed threats to ratchet up tariffs on China, disclosed via Twitter in early May. However, news Wednesday highlighted more reasons to think the alleged “trade war” isn’t as risky as many presume.

Take Huawei. When Trump announced the supplier “ban” in mid-May, many assumed this would prevent US firms from transacting with China. But the ban isn’t actually, well, a “ban,” as it turns out. Huawei’s entry onto the “entity” list—a list of foreign companies subject to export restrictions—applies to US-made products. But manufacturing is global. As The New York Times reported today, that means US firms’ products manufactured outside America can still be sold to Huawei. As John Neuffer, president of America’s Semiconductor Industry Association put it, “‘As we have discussed with the U.S. government, it is now clear some items may be supplied to Huawei consistent with the entity list and applicable regulations.’” After a brief pause, it appears the industry is legally selling products to Huawei once more, based on commentary from earnings calls. Score one for globalization, we guess. Now, we always questioned the staying power and scope of Huawei restrictions, concluding this wasn’t a huge deal either way. It also looked like Trump employing a non-tariff barrier as leverage in the continuing saga with China over trade. But skirting Huawei restrictions by supplying goods from outside America further waters down any impact.

On the more illicit front, news Wednesday also highlighted a reason why bilateral tariffs don’t pack the punch many presume. The Wall Street Journal featured a stellar report highlighting how Chinese exporters have skirted tariffs on Tech products. The article documented May’s 81% y/y surge in Vietnamese imports of computers and electronic goods from China … and a 72% jump in Vietnam’s exports of the same to the US. Does anyone actually think that is coincidence? While we don’t advocate firms relabeling goods and “transshipping”—shipping goods to another country prior to the US to dodge tariffs—it happens. Further, and less illicitly, sometimes small modifications to products impact the country of origin. The WSJ report shows that is also occurring. We have long argued all currently threatened and implemented tariffs’ maximum impact including global retaliation—0.3% of 2018 global GDP—is too small to derail growth.[i] This news further suggests that estimate is high.

Last, but not least, came the news Trump was set to delay the 25% tariff on $300 billion in Chinese goods presently slated to hit at yearend. Interestingly, this comes as rumors grow of a third US/North Korea summit mount. As Fisher Investments founder and Executive Chairman Ken Fisher has long theorized, Trump’s China tariffs are less about economic policy and more about geopolitics. Trump knows Xi is one of few global leaders with any sway over Kim. Trump needs him to broker talks potentially leading to a denuclearization deal. Xi just returned from paying the first Chinese state visit to Pyongyang in 14 years last week.

Maybe Xi and Trump will hammer out a deal at the G20. Maybe not. Perhaps failing to do so stirs some short-term volatility. But after all the time tariff and trade fears have spent hogging headlines, we suspect markets have already dealt with them. However, we see lots of evidence suggesting the “trade war” that has spawned so many headlines is likely to prove much more bark than bite—a positive surprise for stocks.


[i] Source: FactSet, US Trade Representative, Bloomberg and US Census Bureau. Includes threatened US tariffs on global autos and a yearend hike in tariffs on $300 billion in Chinese goods.

By Fisher Investments Editorial Staff

Full link: https://www.fisherinvestments.com/en-us/marketminder/more-reasons-to-doubt-the-alleged-trade-wars-bite

Brief – Tuần 24 – 29/06/2019

Các sự kiện chính:

Theo tờ Tân Hoa Xã đưa tin, Tổng thống Mỹ Donald Trump và Chủ tịch Trung Quốc Tập Cận Bình vừa đồng ý tạm thời “đình chiến” trong cuộc chiến thương mại đã kéo dài hơn 1 năm nay, loại bỏ mối nguy đang treo lơ lửng đe dọa kinh tế thế giới dù vẫn chưa thể nói rằng hai bên sẽ sớm hòa bình trở lại. Mỹ và Trung Quốc đã nhất trí sẽ tái khởi động các cuộc đàm phán thương mại, và Mỹ đồng ý sẽ không đưa ra sắc lệnh thuế quan mới. Bài báo cũng cho biết ông Tập khẳng định các cuộc đàm phán phải dựa trên cơ sở công bằng, đồng thời ông thể hiện sự ủng hộ các cuộc đàm phán với Triều Tiên và tái khẳng định chủ quyền trên đảo Đài Loan.

Các chỉ số sản lượng điện năm 2018 do Bộ Công Thương công bố cho biết đều tăng trên 10% so với năm 2017. Nhưng 100% dự án nhà máy điện của PVN, TKV đều chậm tiến độ với hàng chục dự án điện (chiếm 71,5% trên tổng số) như hiện nay, tình hình cung cấp điện tiếp tục được đánh giá hết sức khó khăn trong vài năm tới.

Không chỉ có vậy, trước mắt, Việt Nam có thể thiếu 500.000 tấn thịt heo trước Tết Nguyên đán phần lớn do dịch tả heo châu Phi lan rộng khiến nguồn cung lẫn sức tiêu thụ giảm mạnh trong giai đoạn cuối năm nay – theo Ipsos Consulting.

Theo nhận định từ Tổng cục Thống kê, Việt Nam tiếp tục là điểm đến thu hút khách du lịch quốc tế, với lượng khách liên tục đạt mức trên 1 triệu lượt người mỗi tháng kể từ đầu năm 2019. Khách quốc tế đến Việt Nam trong tháng 6/2019 đạt mức thấp nhất kể từ đầu năm, đồng thời tốc độ tăng lượng khách trong 6 tháng đầu năm nay cũng chỉ đạt 7,5%, thấp hơn nhiều so với mức tăng giai đoạn 2016-2018 – đạt gần 8,5 triệu lượt người, tuy nhiên, lượng khách đang có xu hướng giảm tốc.

Tại sao nó ảnh hưởng:

Kể từ khi các cuộc đàm phán đổ vỡ hôm 10/5, ông Trump đã tăng thuế từ 10% lên 25% đối với 200 tỷ USD hàng Trung Quốc và dọa sẽ đánh thuế 10% đối với số hàng hóa còn lại mà Mỹ nhập khẩu từ Trung Quốc, trị giá khoảng 300 tỷ USD.

Báo cáo về Tình hình thực hiện các dự án điện trong sơ đồ điện VII điều chỉnh, phát hành ngày 4/6 mới đây; tổng công suất các nguồn điện dự kiến đưa vào vận hành giai đoạn 2016 – 2020 trên toàn hệ thống là 21.650 MW. Trong đó, nguồn điện do Tập đoàn Điện lực Việt Nam (EVN) là 7.185 MW (chiếm 333.2%), các nguồn điện do các doanh nghiệp khác đầu tư là 14.465 MW (chiếm 66,8%) mà ở đó chủ lực là các dự án thuộc Tập đoàn Dầu khí Việt Nam (PVN), Tập đoàn Công nghiệp Than – Khoáng sản Việt Nam (TKV). Tổng hợp tình hình thực hiện tiến độ 62 dự án có công suất lớn trên 200 MW có tới 47 dự án chậm tiến độ hoặc chưa xác định tiến độ so với quy hoạch ban đầu. Trong số 23 dự án đầu tư phát triển nguồn điện do EVN thực hiện với tổng công suất 14.809 MW  từ 2016 – 2030 thì có tới 13 dự án chậm hoặc lùi tiến độ. Nghiêm trọng hơn cả là 100% dự án của PVN, TKV đều đang trong tình trạng gặp nhiều khó khăn vướng mắc và khó có thể hoàn thành theo đúng tiến độ trong Quy hoạch điện 7 điều chỉnh.

Theo cung cầu thị trường của công ty nghiên cứu Ipsos Consulting, dịch tả heo châu Phi đã xuất hiện tại khoảng 60 tỉnh, thành phố với khoảng 2,6 triệu con heo bị tiêu huỷ. Tổng đàn nái cả nước đến cuối tháng này ước tính giảm 30% so với cùng kỳ năm ngoái. Trong đó, hộ chăn nuôi nhỏ lẻ là phân khúc bị ảnh hưởng nặng nhất vì thiếu các biện pháp phòng ngừa và an toàn sinh học. Nhu cầu tiêu thụ thịt heo cũng suy giảm khi người tiêu dùng cắt giảm tạm thời vì tâm lý lo sợ ảnh hưởng đến sức khoẻ. Nhiều gia đình đã thay đổi cơ cấu bữa ăn, các nhà hàng và bếp công nghiệp cũng thay thế thịt heo bằng gia cầm, gia súc khác.

Thiếu hạ tầng du lịch, thiếu sức hút điểm đến cùng với tính tự phát, thiếu hệ sinh thái hoàn chỉnh phần nào chính là lý do khiến cho dù được coi là rất tiềm năng nhưng Việt Nam dần dần trở nên “hụt hơi” trong cuộc đua thu hút du lịch quốc tế…

Xu hướng chính:

Việc 2 bên đồng ý quay trở lại bàn đàm phán kết thúc 6 tuần đầy căng thẳng đối với các công ty và nhà đầu tư, và ít nhất là làm giảm nỗi lo sợ rằng 2 nền kinh tế lớn nhất thế giới đang tiến đến 1 cuộc chiến tranh lạnh. Tuy nhiên vẫn chưa rõ liệu 2 bên có thể vượt qua những sự khác biệt mà đã dẫn đến sự sụp đổ của “lệnh ngừng bắn” đã đạt được sau hội nghị G20 năm ngoái.

PVN được giao 8 dự án trọng điểm nguồn điện với tổng công suất 11.400 MW. Giai đoạn 2016 – 2020 có 3 dự án và giai đoạn 2021 – 2025 là 5 dự án. Đến nay, cả 8 dự án của PVN đều đang rất khó khăn, nhiều dự án đã chậm tiến độ 2 – 3 năm như Nhiệt điện Thái Bình 2, Nhiệt điện Sông Hậu 1, Nhiệt điện Nhơn Trạch 3,4, Long Phú 1… Trong khi đó, đối với TKV, đơn vị này được giao thực hiện 4 dự án với tổng công suất là 2.950 MW. Trong đó giai đoạn 2016 – 2020 có 2  dự án và giai đoạn 2021 – 2030 2 dự án. Hiện cả 4 dự án đều đang chậm tiến độ từ 2 năm trở lên như Nhiệt điện Na Dương 2, Nhiệt điện Hải Phòng 3 chậm tiến độ 3 năm; Nhiệt điện Quỳnh Lập 1 chậm tiến độ 4 năm; thậm chí Nhiệt điện Cẩm Phả 3 còn chưa xác định được tiến độ.

Sức tiêu thụ giảm nhưng nguồn cung biến động mạnh hơn nên cán cân cung cầu thịt heo được dự báo lệch lớn trong giai đoạn cuối năm. Ước tính từ tháng 7/2019 đến gần Tết Nguyên đán năm sau, Việt Nam có thể thiếu 500.000 tấn thịt heo.

Cái gì tiếp theo:

Cục Hải quan cho biết lượng thịt heo nhập khẩu qua các cảng trong 6 tháng đầu năm (tính đến ngày 19/6) tăng gấp 4 lần so với cùng kỳ năm ngoái. Ước tính các doanh nghiệp đã chi gần 7 triệu USD để nhập thịt heo với khoảng 4.000 tấn thịt dạng đông lạnh. Nguồn hàng chủ yếu đến từ Mỹ, Canada, Tây Ban Nha, Đức, Ba Lan… Việc tăng nhập khẩu, cộng thêm việc các hộ chăn nuôi chưa dám tái đàn, khiến giá bán lẻ thịt heo sẽ tăng mạnh và tác động đến chỉ số giá tiêu dùng giai đoạn cuối năm nay và đầu năm sau. Các nhà nghiên cứu dự báo dịch tả heo châu Phi khiến thị trường heo Việt Nam trong giai đoạn này phân hoá thành 4 xu hướng chính là tăng nhập khẩu, tăng giá bán lẻ, tăng sức mua các loại thịt thay thế và thịt heo có thương hiệu.

Dấu hiệu rủi ro:

Việc phát triển năng lượng tái tạo để góp phần bù đắp với tổng công suất khoảng 10.500 MW cũng đang có những khó khăn bởi chủ yếu tập trung phát triển ở khu vực phụ tải tại chỗ rất thấp. Do đó các địa phương đã được bổ sung quy hoạch các dự án điện gió, điện mặt trời với quy mô công suất lớn thì hầu hết công suất phát của các dự án sẽ phải thực hiện thu gom, đấu nối lên lưới điện truyền tải và đưa đến các khu vực có nhu cầu sử dụng điện. Đó là chưa kể sự thiếu hụt nhiên liệu như than, dầu, khí… khiến việc sản xuất điện càng trở nên khó khăn hơn. Tất cả những lý do đó tạo nên một bức tranh khá ảm đạm về khả năng cung ứng điện trong thời gian tới…

Trao đổi với các phóng viên sau cuộc gặp với ông Tập bên lề hội nghị G20, ông Trump cho biết kết quả cuộc gặp rất tốt đẹp: “Tuyệt vời. Chúng tôi đã bàn luận về rất nhiều thứ và đang quay trở lại con đường đúng đắn” –

liệu lời phát biểu của ông Trump có thực sự đem lại hòa bình cho thương mại toàn cầu sau một loạt các đòn trả đũa qua lại không chỉ của Mỹ mà còn của các đồng minh và Trung Quốc đã quá khốc liệt…

Sau tất cả vẫn chỉ là dân thường – những người lao động mới là nạn nhân cuối cùng…

Nóng, chật chội và không phẳng…

xxx- NPL